Connect Superset to DolphinDB
Apache Superset is an open-source BI, reporting and charting tool. It provides rich options from simple line charts to highly detailed geospatial charts. This tutorial introduces how to connect Superset to DolphinDB for data visualization and analysis, enabling the monitoring of business metrics to make data-informed decisions.
Note: Since Superset uses the catalog feature to access the database, DolphinDB version 3.00.0 or higher is required for this tutorial.
1. Deployment
This chapter introduces the installation of Superset in a Python virtual environment.
1.1 Creating a Python Virtual Environment
Miniconda is a free, miniature installation of Anaconda Distribution that includes only conda, Python, the packages they both depend on, and a small number of other useful packages. It is highly recommended to install Superset within a virtual environment to isolate dependencies and avoid compatibility issues, as Superset relies on many packages. See Installing Miniconda for instructions.Execute the following command to create and activate a virtual environment with Python version 3.10 or higher.
conda create -n superset python==3.11
conda activate superset
1.2 Installing Superset
Download requirements.txt and install Superset and its dependencies using the
pip command.
pip install -r requirements.txtInstall pydolphindb version 1.1.1 or higher, which implements the Python Database API v2.0 required by Superset.
pip install pydolphindb==1.1.11.3 Initializing Superset
Create the superset_config.py file and set a secret key. It is recommended
to use a random string of at least 32 characters. You can generate it using the
Dolphinscript: rand(33..126, 32).concat("").base64Encode().
echo "SECRET_KEY = 'cIgiAjJyZoxb4FfPzxQ8CdLJa+afcA5m+r3ezwe7XGzJ/Qj1VQWnGHRU'" > superset_config.py Configure environment variables and initialize Superset.
export FLASK_APP=superset

# Replace with your path
export SUPERSET_HOME=/home/peter/superset
# Replace with your path
export SUPERSET_CONFIG_PATH=/home/peter/superset/superset_config.py

# Initialize the database
superset db upgrade

# Create an admin user
flask fab create-admin

# Create default roles and permissions
superset init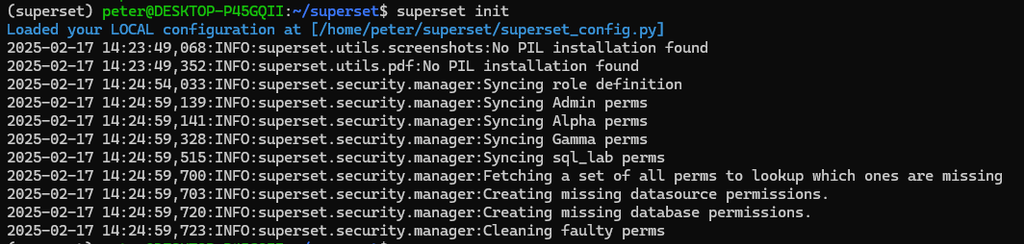
Start a development web server on port 8088. Use -p to bind to another port.
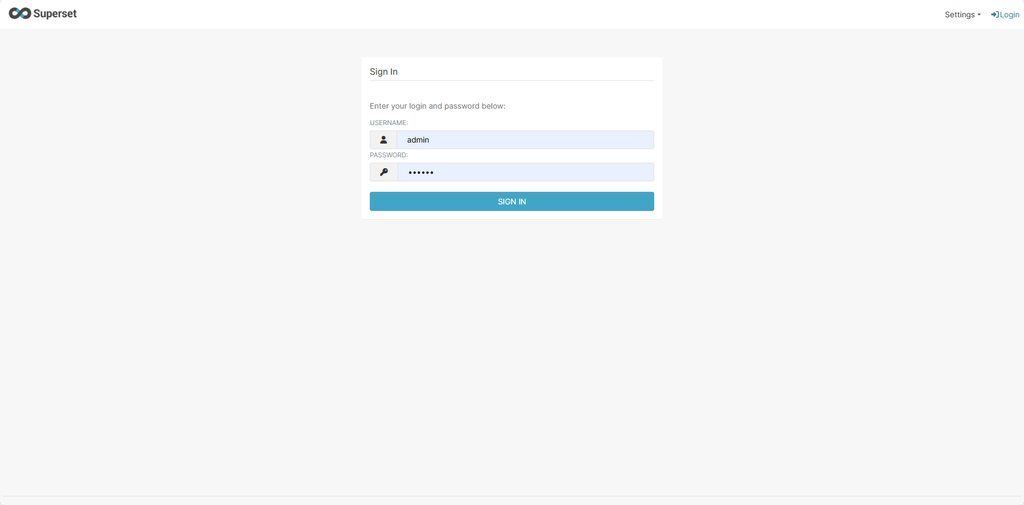
superset run -h 0.0.0.0 -p 8088 --with-threads --reload --debuggerIf everything worked, you should be able to navigate to
hostname:port in your browser
(localhost:8088 by default) and log in using the username
and password you’ve created.
Refer to Configuring Superset for more configurations.
2. Data Preparation
Simulate the dataset for later visual analysis using the MockData module.
Download it and place the module file under the directory
[home]/modules.
use MockData

//creat a catalog
createCatalog("stock")
go
use catalog stock

//creat a table for snatshot market data
t = stockSnapShotPT("dfs://level2", "snapshot")
createSchema("stock", "dfs://level2", "level2")
// mock data
data = stockSnapshot(2020.01.06, 100)
go
tableInsert(t, data)

select * from data limit 100

//create a shared table
tmp = select * from level2.snapshot limit 100000
share tmp as snapshotg
3. Connect to DolphinDB
Create a database connection to DolphinDB and a dataset for Superset to access data from DolphinDB.
3.1 Create a Connection
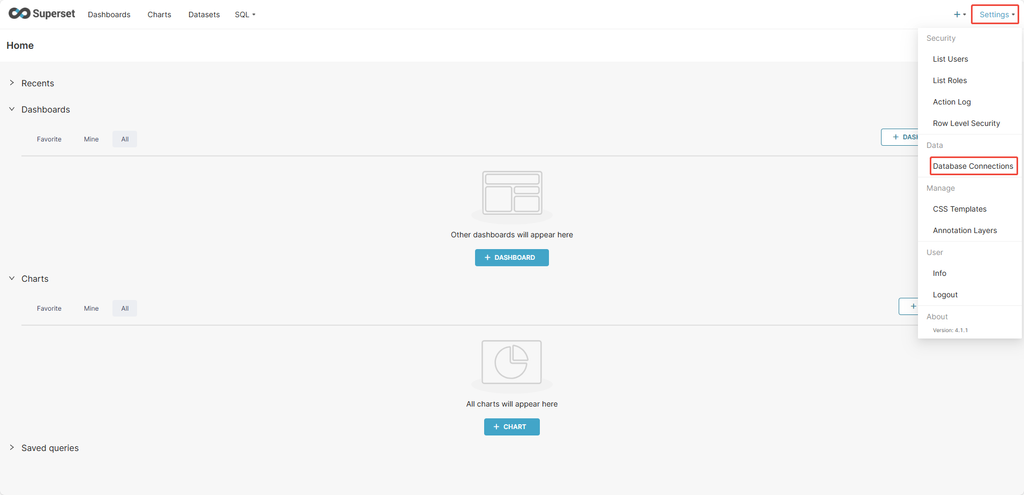
Click Settings in the top right corner and click Database Connections.
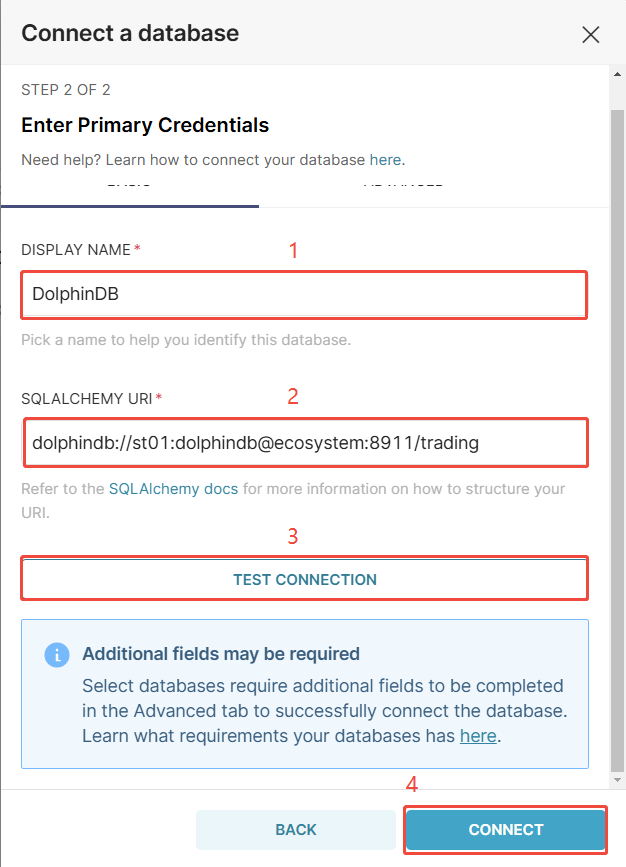
Click + DATABASE in the top right corner, and select DolphinDB as the database to connect.

Enter the SQLAlchemy URI as
dolphindb://user:password@host:port/catalog.
| Parameter | Description |
|---|---|
| user | The username for the DolphinDB server. |
| password | The password for the user. |
| host | The host or IP of the DolphinDB server. |
| port | The port of the DolphinDB server. |
| catalog | The catalog name. |
Click TEST CONNECTION to check whether the connection is successful. Then click CONNECT to finish.
The system will navigate to the Databases page if successful.
3.2 Create a Dataset
Superset uses datasets to manage data, which is also the data source for charts.
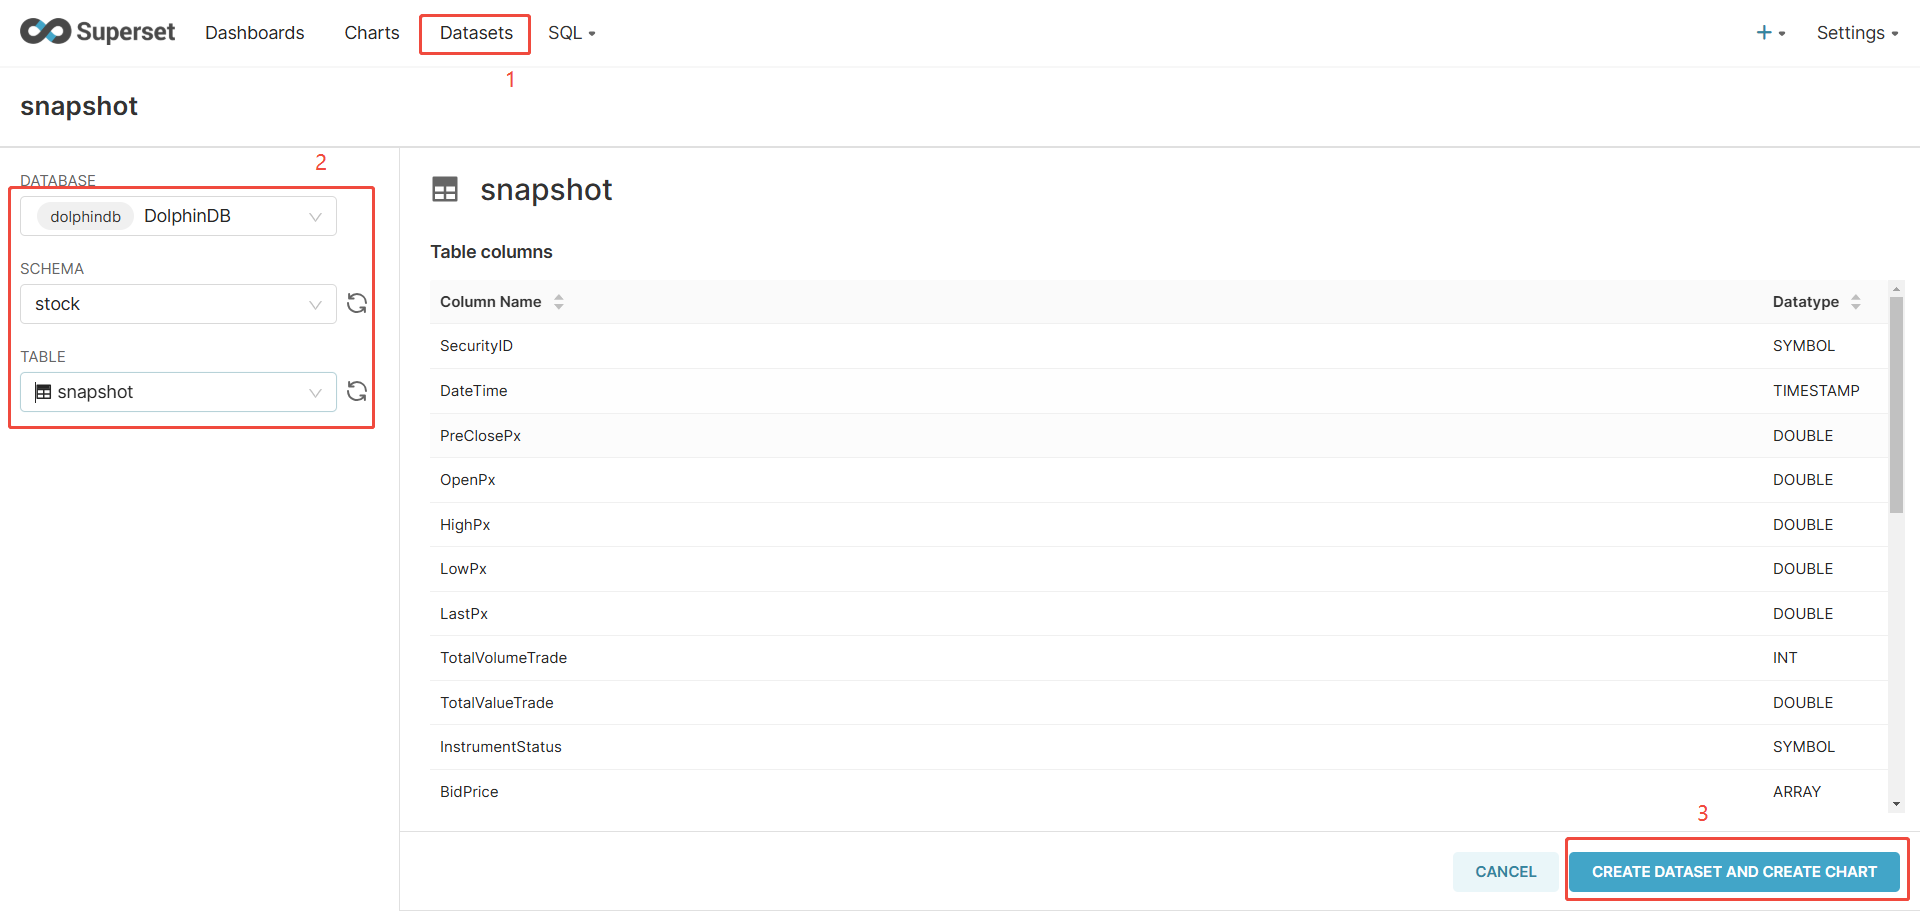
- Click + DATASET.
- Select the database, schema, and table.
- Click CREATE DATASET AND CREATE CHART.
In addition to DFS tables, you may also select _shared_table to use the shared tables as the data source. Superset caches metadata like table structures to improve performance. If the schemas or tables displayed are outdated, click the refresh button to update the metadata.
4. Visualization Analysis
In the following examples, we will create charts for analyzing stock market data, including depth of market, trade volume distribution, market data, etc.
4.1 Depth of Market
Depth of market (DOM) is a measure of the supply and demand for liquid, tradeable assets. It reflects the supply and demand of the market. We can plot a line chart to observe the trend of bid and ask depth over time for a stock.
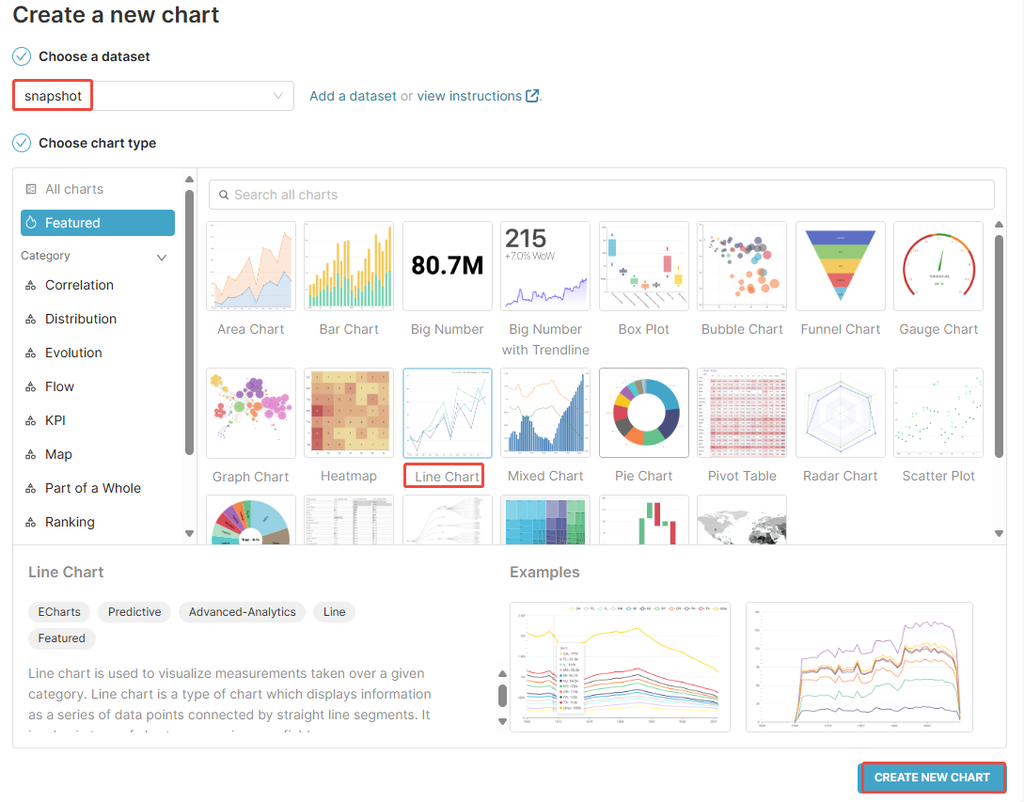
- Click Charts in the top navigation bar.
- Click + CHART in the top-right corner.
- Select the snapshot dataset created in Chapter 3.
- Select Line Chart as the chart type.
- Click CREATE NEW CHART to finish.
Configuration Options:
- X-AXIS
The X-axis. For trend charts, it is typically a time field.
- TIME GRAIN
The time granularity used to aggregate the time columns on the X-axis. This determines how data is grouped (by minute, day, etc.) in the chart.
- FILTERS
The filters applied to the dataset. This option is similar to WHERE conditions in SQL queries.
- METRICS
The metrics to be displayed on the chart. It is recommended to use Custom SQL for better flexibility and performance.
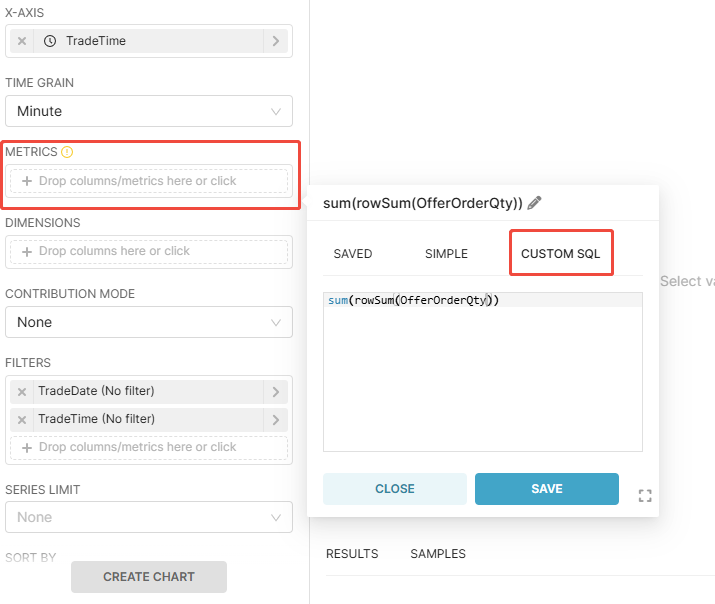
Figure 8. 4-2 Customize Metrics
To calculate the bid and ask queue depths, enter the following queries respectively in CUSTOM SQL:
sum(rowSum(OfferOrderQty))for the ask queuesum(rowSum(BidOrderQty))for the bid queue
The CUSTOM SQL supports all DolphinDB SQL syntaxes, including built-in and user-defined functions. This allows users to leverage DolphinDB’s analytical capabilities (function library and programming language) to visualize complex metrics efficiently.
Click CREATE CHART to generate the chart.
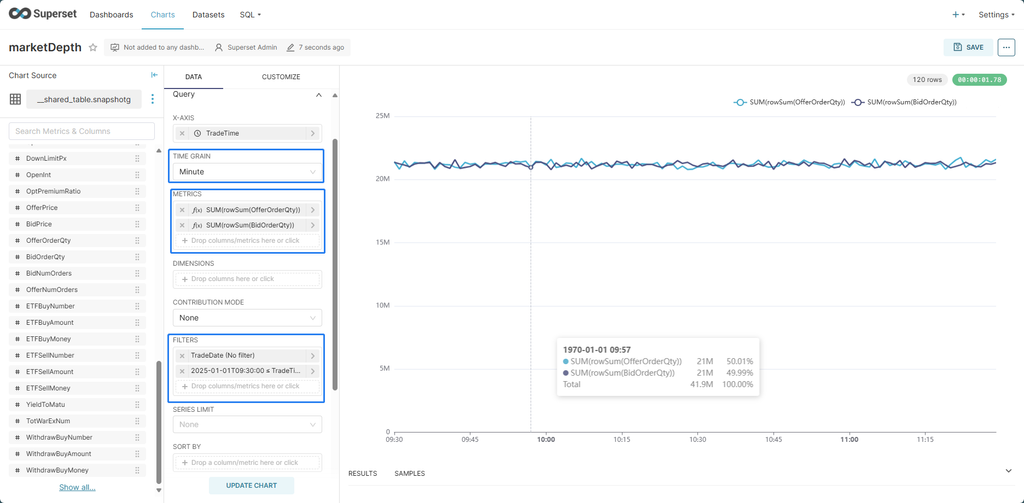
For complex SQL queries, you can use the View query option in the top-right corner's extended menu to check whether the SQL query is correct.
For the chart above, the corresponding SQL query is as follows:
SELECT minute(_"TradeTime") as _"minute_TradeTime", SUM(rowSum(OfferOrderQty)) as _"SUM_rowSum_OfferOrderQty", SUM(rowSum(BidOrderQty)) as _"SUM_rowSum_BidOrderQty"
FROM snapshotg
WHERE _"TradeTime" >= time("09:30:00.000") && _"TradeTime" < time("11:30:00.000") GROUP BY minute(_"TradeTime") ORDER BY _"SUM_rowSum_OfferOrderQty" desc
 LIMIT 10000;
Finally, click SAVE in the top-right corner and enter a CHART NAME to save the chart.
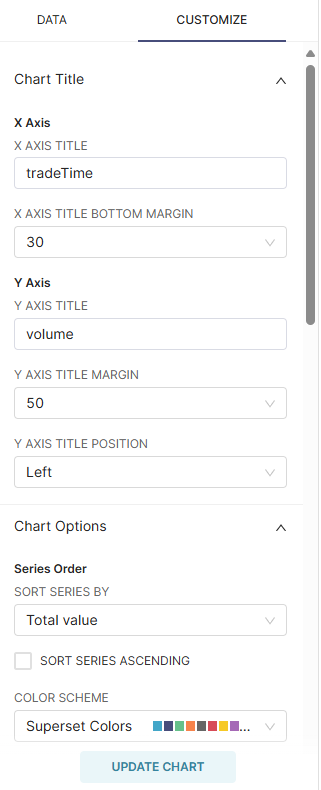
Chart Customization
Adjust the chart's formatting and appearance settings in CUSTOMIZE.
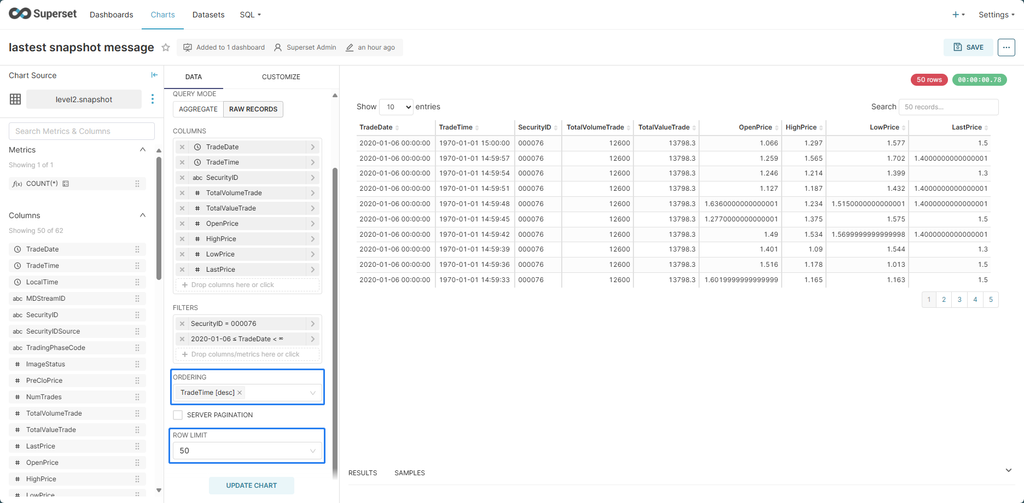
4.2 Latest Market Data
To view the latest 100 records of market data for a stock, including trade time, price, and 10-level quote (ArrayVector):
- Select Table as the chart type.
- In FILTERS, drag the SecurityID field in and select the stock. No need to manually add quotation marks around string values.
- Set ORDERING to TradeTime[desc] to sort by trade time in descending order.
- Set ROW LIMIT to 50 to control the total rows to be displayed.
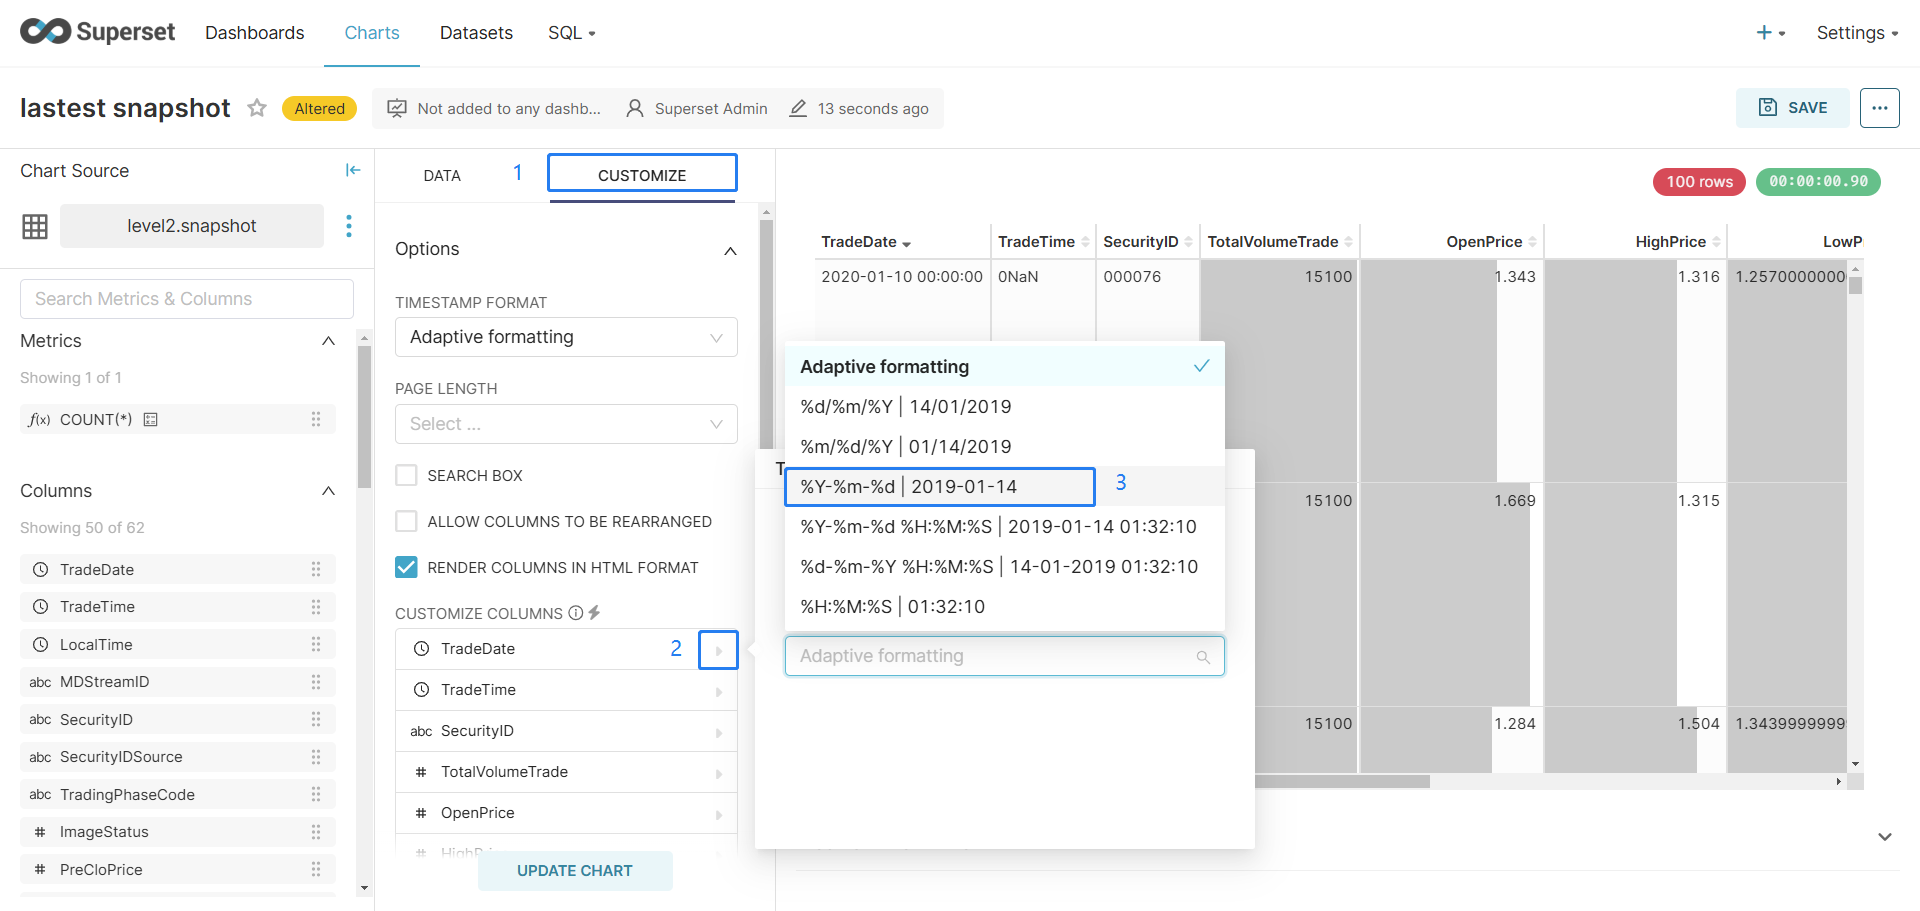
To adjust the format of the tradeDate field (datetime by default):
- Click CUSTOMIZE.
- Click CUSTOMIZE COLUMN.
- Select
%Y-%m-%dto show its date only.
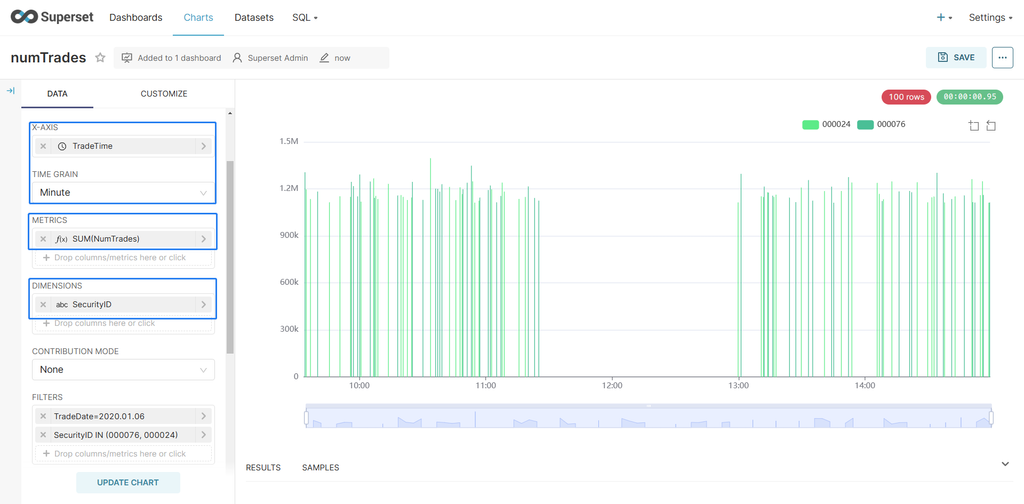
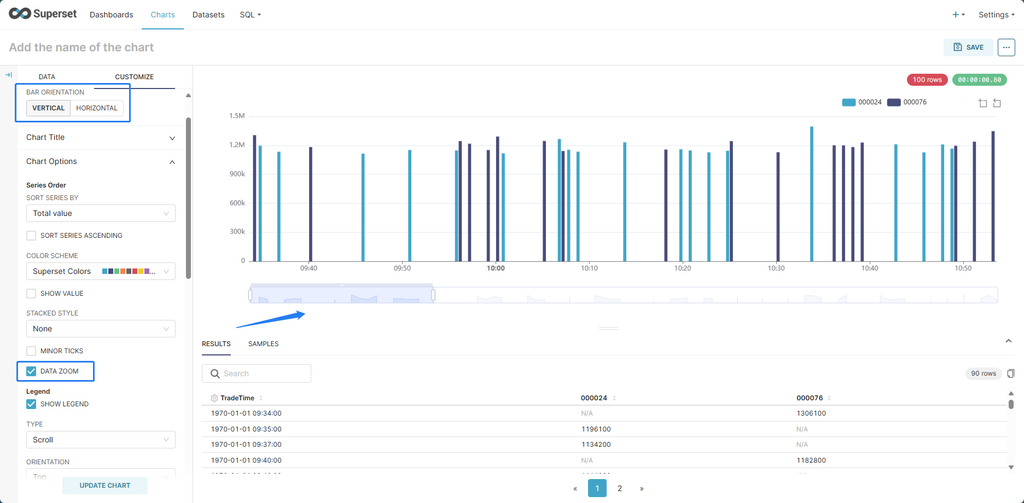
4.3 Volume Distribution Charts
Visualize the per-minute trading volume for stocks "000024" and "000076".
- Select Bar Chart as the chart type.
- Configure the options as shown in the image below.
- Select SecurityID in DIMENSIONS.
- In FILTERS, select the SecurityID and TradeDate fields for the target stocks and trading date.
In CUSTOMIZE, you can modify the orientation of the bar chart. Select DATA ZOOM to enable zooming on the X-axis.
4.4 Word Cloud
A Word Cloud chart is a highly visual way to highlight focuses. It is particularly useful for displaying trending stocks in markets.
First, select Word Cloud as the chart type. Then, configure the parameters as shown in the example below.
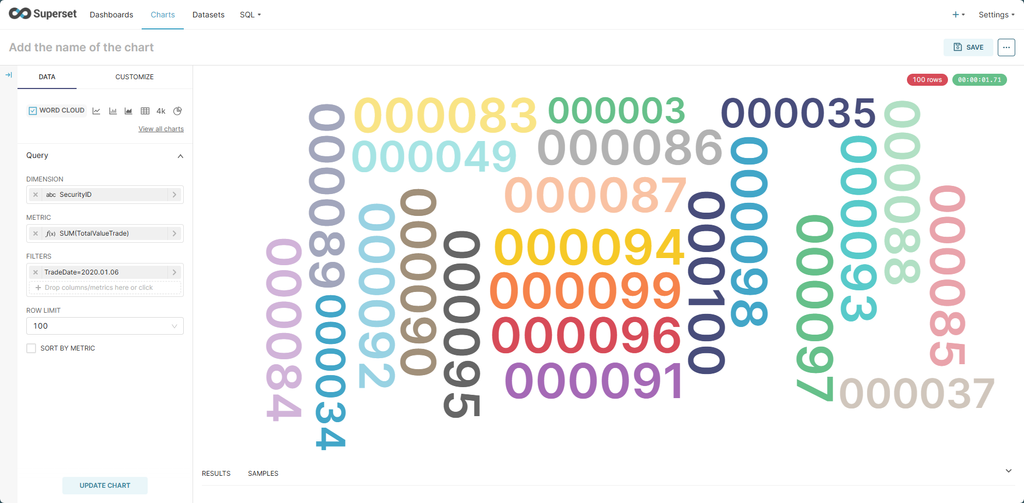
In DIMENSION, select SecurityID. In METRIC, enter
sum(totalValueTrade) to control the size of each word based
on the total trade values.
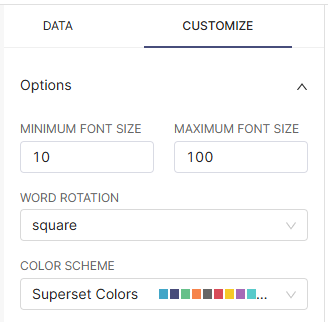
In CUSTOMIZE, you can control the word rotation and the font size.
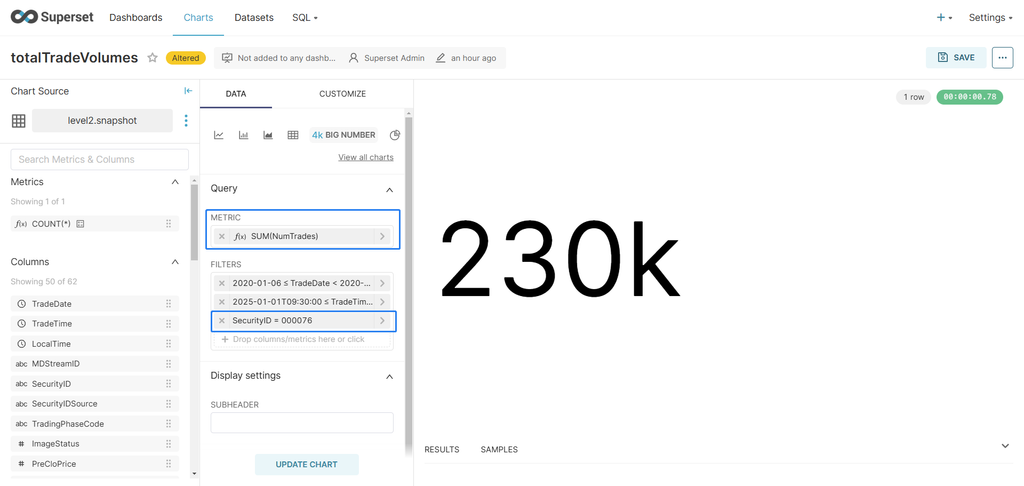
4.5 Total Trade Volume
Display the total trade volume for a specific stock on a trading day:
- Select Big Number as the chart type.
- Configure the parameters as shown in the image below.
- In METRIC, enter
sum(NumTrades)to calculate the total trade volume. - In FILTERS, select the stock.
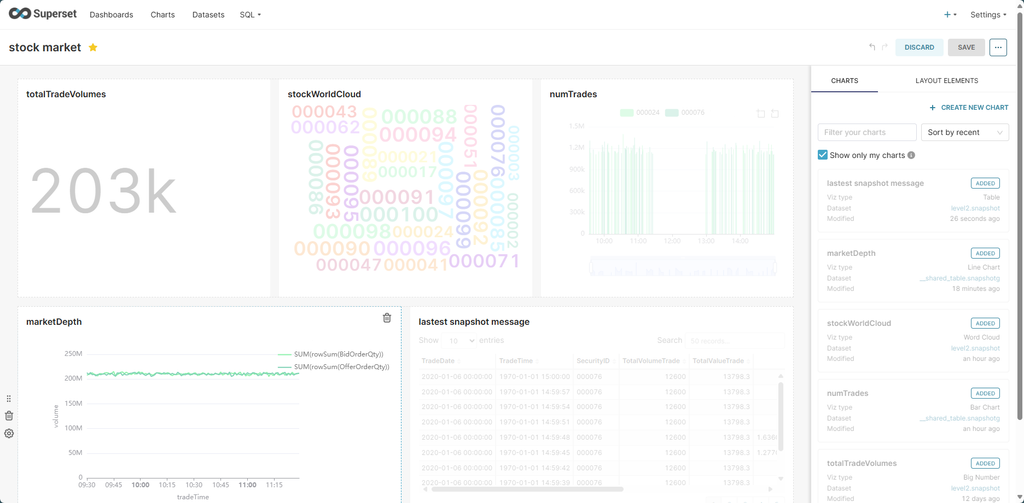
4.6 Dashboards
4.6.1 Create a Dashboard
Dashboards allow users to combine multiple charts into a single view to present multidimensional data in a structured format. This enables users to analyze business performance from various perspectives, uncover patterns, and identify potential issues.
Click +Dashboards. Drag charts from the panel on the right into the dashboard. You can also reposition and resize the charts by dragging them.
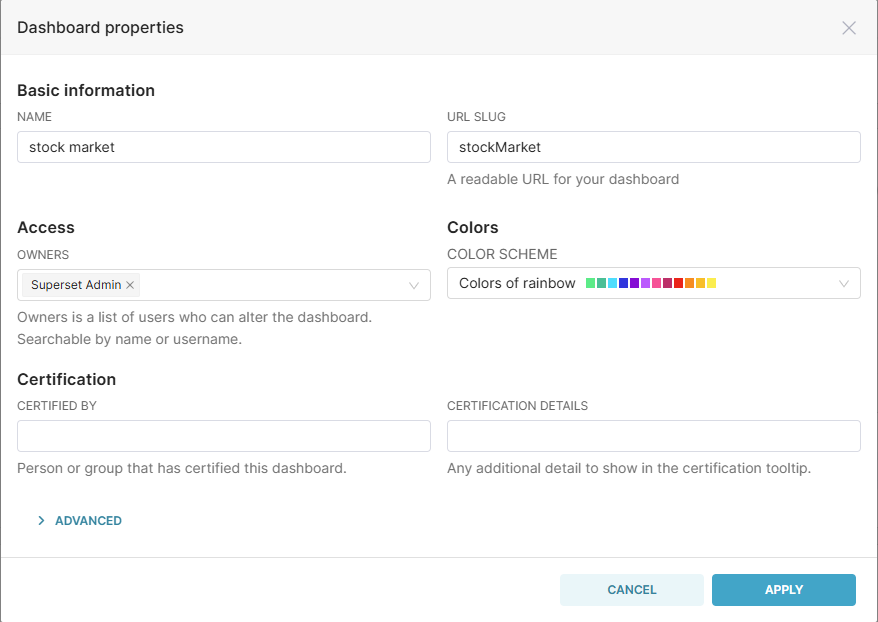
Click the ⋯ button in the top-right corner and select Edit properties to set the name, permissions, and color scheme.
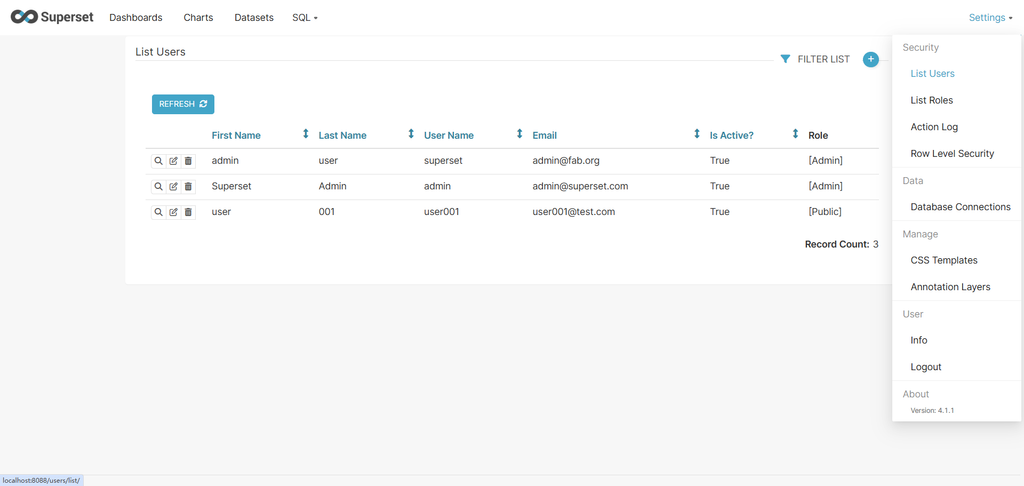
4.6.2 Share a Dashboard
Click Share → Copy permalink to clipboard to get a URL for sharing the dashboard with other users of Superset. Superset supports role-based access control. Click Settings → List Users/List Roles to manage user and group permissions.
The default URL (e.g.,
http://ip:port/superset/dashboard/p/8pGRY22dK9D/) is
hard to remember. You can set a custom URL Slug (e.g., stockMarket as
in Figure 4-13) to access the dashboard via a more memorable link like
http://ip:port/superset/dashboard/stockMarket.
5. Summary
This tutorial introduces how to perform visual analytics by connecting Superset to
DolphinDB. Overall, Superset is a user-friendly visualization tool with rich charts.
The integration works by calling metadata interfaces provided by
pydolphindb, enabling Superset to interact with DolphinDB.
However, some features are not yet fully supported:
- In Superset, TIME columns appear with a fixed date prefix of
1970-01-01. This is due to Superset's use ofpandas.datetimefor displaying time columns, which converts DolphinDB's TIME data to theYYYY-MM-DD HH:mm:ssformat forcefully. - The TIME GRAIN option does not support Week, Month, and Quarter.
- Handlebars, Event Flow, and Map charts are not currently supported.
Please refer to the Superset documentation for more information.
Note: The sample data used in this tutorial is for instructional purposes only and differs significantly from the real market data. As a result, some charts in this tutorial may not align with your business intuition.