Introduction to CEP Engine: Building a Simple Price-Volume Strategy
High-frequency trading relies on analyzing vast amounts of real-time market data to capture small price fluctuations for quick profits. DolphinDB, with its powerful computing and advanced features, is a robust platform for developing and testing high-frequency trading strategies.
In this article, we’ll focus on the complex event processing (CEP) engine within DolphinDB's streaming framework. The CEP engine enables real-time analysis of complex data streams, identifying and responding to events that match predefined patterns—something traditional stream processing can’t handle efficiently. We’ll walk through two practical examples to show how the CEP engine can be used for effective event stream processing.
1. Core Concepts
This section introduces the core concepts of the CEP engine. These concepts are essential for understanding the capabilities of the engine.
1.1 Event and Complex Event
In the DolphinDB CEP system, an event is a data representation of a specific occurrence or state within a given time frame, essentially a collection of attribute values describing a change in an object. For example, "buying 1 share of AAPL stock at $170.85" and "BRK rose 5% on June 12, 2024" are both events. Events are continuously generated and exist as streams.
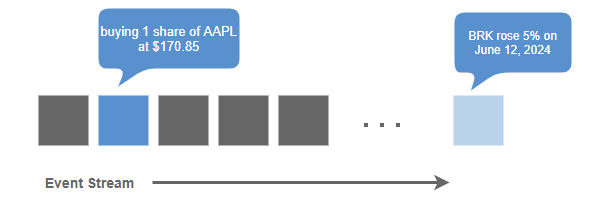
When defining an event, we must specify both the event type and the name and type of each attribute it includes. We use classes to represent events, where the class name corresponds to the event type, and the instances of the class represent specific occurrences of the event. Event streams can be stored in stream tables, with each row in the table representing a distinct event.
Complex event processing extends beyond individual events to incorporate sophisticated matching rules and filters across event streams. Common matching rules include:
- Event Sequence Rules: For example, "CCI enters the overbought zone within 30 seconds after MACD shows a golden cross"
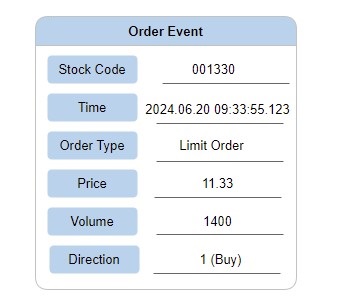
- Event Property Value Rules: For example, "A trading event where the trading volume exceeds 50,000 shares"
- Time-based Rules: For example, "After receiving a trade confirmation for Stock A, no new orders for Stock A will be placed within the next minute"
In DolphinDB, these various matching rules are primarily expressed through
different parameters of addEventListener.
1.2 Monitor
A monitor is a component in the CEP system responsible for monitoring and responding to events, containing the complete business logic.
Monitors are defined using classes. A monitor is instantiated when creating a CEP
engine using createCEPEngine. It contains the following
elements:
- One or more event listeners. Event listeners are used to capture events based on specific rules.
- One or more callback functions. These are operations executed after specific events are captured.
- An
onloadmethod. It is executed only once when the monitor is instantiated, typically including the startup of one or more event listeners.
1.3 Event Listener
An event listener contains specific event rules that need to be captured. It can perform real-time rule matching, triggering preset operations once conditions are met. These conditions range from simple threshold checks to complex market pattern detection - such as sequence-based rules or time-based constraints.
Event listeners for specific events are started by executing
addEventListener within the monitor. Different parameter
configurations in addEventListener allow for flexible
description of matching rules.
For example, in quantitative trading, the monitor can be viewed as a container for trading logic, while event listeners are components within the container used to detect specific market conditions. A monitor may contain multiple event listeners, with each listener responsible for monitoring a specific type of market activity or condition. When all conditions are met, the monitor (i.e., trading strategy) will execute predefined trading actions such as buying, selling, or adjusting positions.
2. Case I: Monitor Stock Prices and Logging
Let's begin with a simple example. Suppose we want to log real-time market quotes. How can we implement this using the CEP engine?
2.1 Define the Event Class
In this basic case study, we'll provide detailed explanations of the code to help you understand the logic. In the subsequent case, we'll focus on more advanced code concepts with fewer step-by-step explanations.
The CEP engine processes events, so we need to first define the events. Here, we define an event class called StockTick, which contains two attributes: the stock name and price, representing price movement information in the market.
// Define an event class representing stock quote events for each tick
class StockTick{
    name :: STRING
    price :: FLOAT
    def StockTick(name_, price_){
        name = name_
        price = price_
    }
}
class StockTick: Defines the StockTick class, used to represent stock ticks received from market data sources.name :: STRING: A STRING attribute within the class, used to store the stock name.price :: FLOAT: A FLOAT attribute within the class, used to store the stock price.def StockTick(name_, price_): Defines the class constructor, used to instantiate a StockTick object.
2.2 Define Monitor and Set Up Event Listener
Next, define a monitor class called SimpleShareSearch. This monitor stores the
latest StockTick event in a variable newTick. When the monitor is initialized,
it calls the onload method, which registers an event listener
to capture all StockTick events and process them in the callback
processTick. processTick updates the class
with the latest event data and logs details about the stock event.
class SimpleShareSearch : CEPMonitor {
	// Stores the latest StockTick event
	newTick :: StockTick
	def SimpleShareSearch(){
		newTick = StockTick("init", 0.0)
	}
	def processTick(stockTickEvent)
	def onload() {
		addEventListener(handler=processTick, eventType="StockTick", times="all")
	}
	def processTick(stockTickEvent) {
		newTick = stockTickEvent
		str = "StockTick event received" +
			" name = " + newTick.name +
			" Price = " + newTick.price.string()
		writeLog(str)
	}
}
class SimpleShareSearch: Defines a monitor class named SimpleShareSearch.newTick :: StockTick: An attribute newTick of type StockTick, used to store the latest StockTick event.def SimpleShareSearch(): Defines the constructor of the class.def onload(): A required method for the monitor. When the CEP engine is created, it instantiates the monitor and callsonloadto initialize the monitor.. In this example, an event listener is started.addEventListener(handler=processTick, eventType="StockTick", times="all"): Registers an event listener within theonloadmethod. When the engine is created, it immediately starts listening for events of type StockTick and processes each matching event withprocessTick. The default setting for the times parameter is "all", indicating that the listener will respond to every matching event. If times=1, the event listener will stop after processing the first matching event. For detailed parameter settings, refer to the function documentation.def processTick(stockTickEvent): This method handles incoming StockTick events, logging their details when received. As with any class member method,processTickmust be declared before it's used - in this case, before theaddEventListenercall inonload.newTick = stockTickEvent: Updates the monitor's newTick attribute with the latest event. In this case, this step is not strictly necessary but is included to demonstrate that a monitor can store variables during runtime. This capability could be used to compare previous and current stock quotes
2.3 Create the CEP Engine
Create a CEP engine, configure the table schema and monitor, so that the engine can receive and process StockTick events.
dummyTable = table(array(STRING, 0) as eventType, array(BLOB, 0) as eventBody)
try {dropStreamEngine(`simpleMonitor)} catch(ex) {}
createCEPEngine(name="simpleMonitor", monitors=<SimpleShareSearch()>,
dummyTable=dummyTable, eventSchema=[StockTick])dummyTable: A table with two columns, eventType and eventBody. It is specified as the dummyTable parameter increateCEPEngine, serving as the input table for the CEP engine. The dummyTable parameter will be further explained in section 2.4.try {dropStreamEngine(simpleMonitor) } catch(ex) {}: This is a common environment cleanup approach in CEP engine applications. If an engine with the same name already exists, the engine creation will fail. Therefore, before creating the engine, an attempt is made to drop the existing stream engine named simpleMonitor, and any exceptions that arise (e.g., if the engine does not exist) are caught.createCEPEngine: Creates a CEP engine named simpleMonitor. The engine will use an instance of the SimpleShareSearch class as its monitor, dummyTable as the input table. The engine will interpret the data in the input table as StockTick event objects.
2.4 Ingest Simulated Data
There are two ways for ingesting events into the CEP engine:
- Directly ingesting events into the CEP engine using the
appendEvent(engine, events)function, avoiding serialization and deserialization. - Serialize events into BLOB format and store the data in a heterogeneous stream table. Then append the table to the CEP engine. As shown in the example above, the engine input table, dummyTable, is configured with the eventType column to store event types, and the eventBody column to store the serialized event data. The benefit of this approach is that it allows different event types to be written into a single stream table. Events can then be ingested into the engine through subscription.
stockTick1 = StockTick('600001', 6.66)
getStreamEngine(`simpleMonitor).appendEvent(stockTick1)
stockTick2 = StockTick('300001', 1666.66)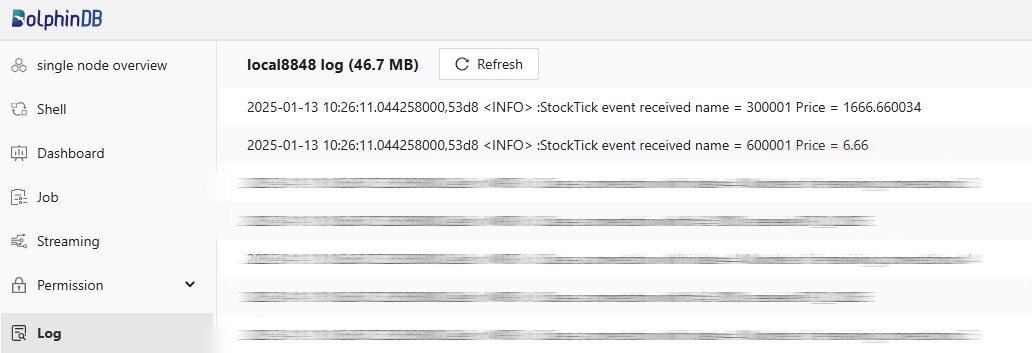
getStreamEngine(`simpleMonitor).appendEvent(stockTick2)- In the script above, two StockTick events are simulated. The first event has a stock code of 600001 and a price of 6.66, while the second event has a stock code of 300001 and a price of 1666.66.
- The
getStreamEnginefunction is used to return the handle of the CEP engine simpleMonitor. TheappendEventfunction is used to directly ingest the two events into the CEP engine.
After ingesting data into the CEP engine, check the logs using the DolphinDB web interface. Refresh page by clicking the Refresh button. We can see that the CEP engine has logged the two events.
2.5 Implementation Process
Let's revisit the implementation process of this case.
- Define the event class that the CEP engine will listen to and process. In this example, a StockTick class with two attributes, name and price, is defined.
- Define a monitor class, which must include the
onloadmethod. This method will be called when the CEP engine is created. In this example,onloadinvokes theaddEventListenerfunction to start listening for events immediately after the engine is created. Each time an event is detected, it is handled by a specified callback function. - Define the callback function, which processes the events. In this example, the callback logs the stock price changes.
- Create the CEP engine. In this example, the engine is created with a name, monitor (monitors), input table schema (dummyTable), and the event types to be processed (eventSchema).
- Simulate event data and ingest it into the engine, then check the logs to verify the results.
This example demonstrates a simple use case of DolphinDB's CEP engine in real-time event monitoring and response. We've covered the basic functionality of the CEP engine, its core concepts, and its execution process.
While DolphinDB's other stream computing frameworks can also process single-type event streams, the CEP engine excels when dealing with more diverse and complex event types, as well as intricate patterns that require monitoring and response. The following case demonstrates how the CEP engine enhances development efficiency in such scenarios.
3. Case II: Implement a Simple High-Frequency Price-Volume Strategy
In the context of financial high-frequency trading, the CEP engine can help users implement complex trading strategies involving multiple events, such as arbitrage and portfolio trading strategies. It can also handle tasks like risk control and visual monitoring. To further explore the capabilities of the CEP engine, let's start with a simple event-driven price-volume factor strategy.
3.1 Strategy Logic
The strategy determines whether to place or cancel an order based on the latest price change and cumulative trading volume of each stock from tick data. The strategy logic is presented in the diagram below:
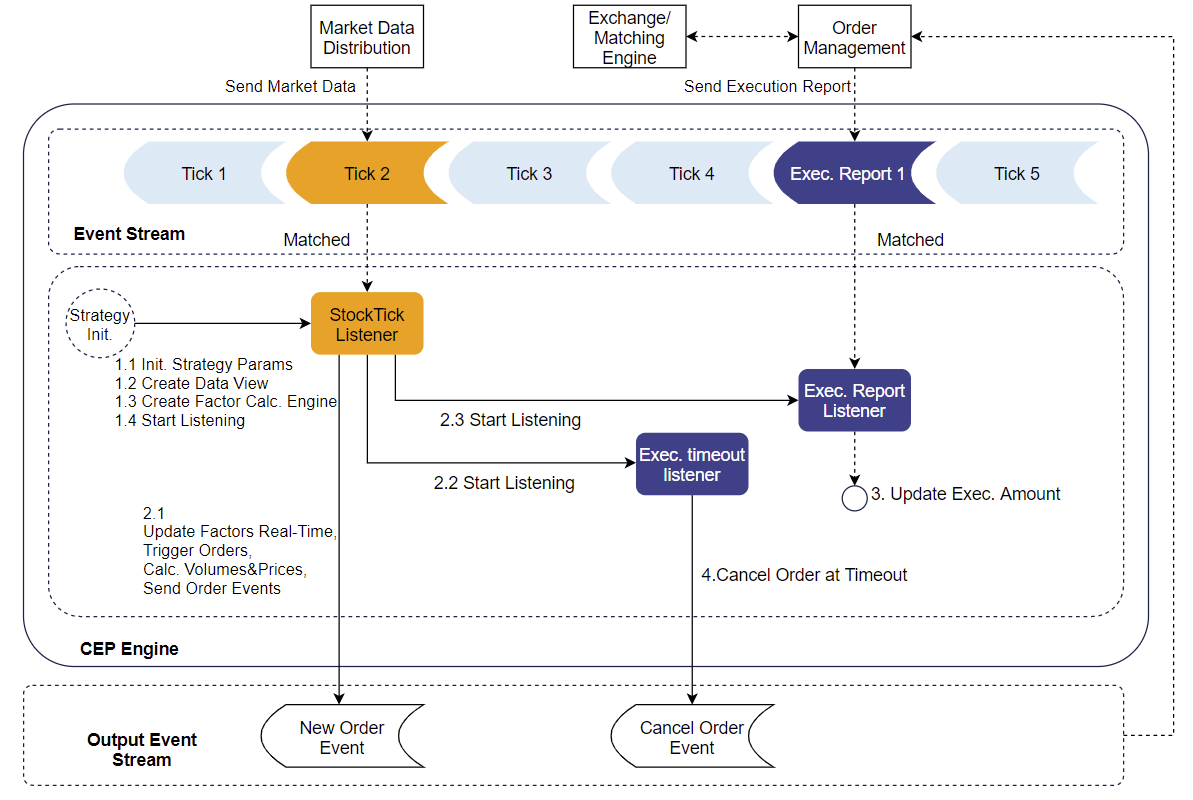
Specifically:
- For each tick, two real-time factors are calculated: the price change (denoted as “ROC”) relative to the lowest price within the last 15 seconds, and the cumulative trading volume over the past minute (demoted as “volume“).
- When the strategy initializes, the thresholds (ROC0 and
volume0) for the two factors per stock are established . As
these factors update in real time, the strategy checks if ROC >
ROC0 and volume > volume0:
- If both conditions are met, an order is triggered.
- If the order remains unfilled after one minute, a cancellation is triggered.
Compared with Case I, this case has the following additional complexities:
- The CEP engine incorporates a reactive state engine and state functions to compute factor values. The reactive state engine supports high-performance incremental calculations on real-time data.
- Sending Events to External Systems. During the execution of the
strategy, when specific conditions are met, the CEP engine needs to send
certain events (in this case, order and cancel events) to external systems
through the
emitEventfunction. - Using a Timeout Timer. The
addEventListenerfunction includes optional parameters for configuring event listener triggers and trigger counts. These optional parameters allow for different types of trigger behaviors, such as event matching, timers, and timeouts. In this example, a new timer is started after each order is placed. If the timer expires, the corresponding operation is triggered.
3.2 Code Implementation
This section provides a detailed explanation of the core code for the case. The complete script can be found in the appendices.
3.2.1 Define Event Classes
// Define trade tick event
class StockTick {
    securityid :: STRING
    time :: TIMESTAMP
    price :: DOUBLE
    volume :: INT
    def StockTick(securityid_, time_, price_, volume_) {
        securityid = securityid_
        time = time_
        price = price_
        volume = volume_
    }
}

// Define execution report event
class ExecutionReport {
    orderid :: STRING
    securityid :: STRING
    price :: DOUBLE
    volume :: INT
    def ExecutionReport(orderid_, securityid_, price_, volume_) {
        orderid = orderid_
        securityid = securityid_
        price = price_
        volume = volume_
    }
}

// Define new order event
class NewOrder {
    orderid :: STRING
    securityid :: STRING
    price :: DOUBLE
    volume :: INT
    side :: INT
    type :: INT
    def NewOrder(orderid_, securityid_, price_, volume_, side_, type_) {
        orderid = orderid_
        securityid = securityid_
        price = price_
        volume = volume_
        side = side_
        type = type_
    }
}

// Define cancel order event
class CancelOrder {
    orderid :: STRING
    def CancelOrder(orderid_) {
        orderid = orderid_
    }
}
3.2.2 Define Monitor and Set up Listeners
We define a StrategyMonitor to encapsulate the overall trading strategy. The monitor is created with a strategy ID and strategy parameters, which are set during initialization.The overall structure of the monitor is as follows:
class StrategyMonitor : CEPMonitor {
	strategyid :: INT // Strategy ID
	strategyParams :: ANY // Strategy parameters: target asset, asset configuration
	dataview :: ANY // Data view monitoring
	def StrategyMonitor(strategyid_, strategyParams_) {
		strategyid = strategyid_
		strategyParams = strategyParams_
	}
	def execReportExceedTimeHandler(orderid, exceedTimeSecurityid)
	def execReportHandler(execReportEvent)
	def handleFactorCalOutput(factorResult)
	def tickHandler(tickEvent)
	def initDataView()
	def createFactorCalEngine()
	def onload(){
		initDataView()
		createFactorCalEngine()
		securityids = strategyParams.keys()
		addEventListener(handler=tickHandler, eventType="StockTick",
		condition=<StockTick.securityid in securityids>, times="all")
	}
}
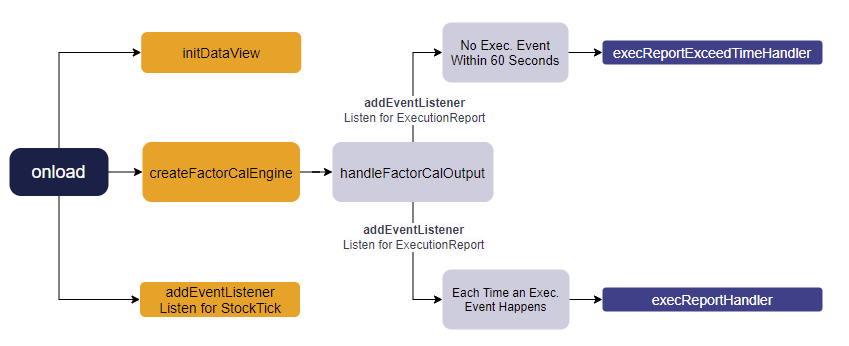
- When the CEP engine is created, the
onloadmethod is called first.onloadinvokesinitDataViewandcreateFactorCalEngine, while adding an event listener to begin listening for StockTick events.Note:TheinitDataViewmethod updates the key values for the web-based strategy monitoring view. It is detailed in Section 4 and won't be discussed further in this section. - The
createFactorCalEnginemethod computes factors based on incoming events. The results are then passed tohandleFactorCalOutputfor further processing. - The
handleFactorCalOutputmethod sets up two listeners to listen for execution report events:- One cancels the order automatically by triggering
execReportExceedTimeHandler, if no execution occurs within 60 seconds - The other updates the order No. and trade amount at each
execution by triggering
execReportHandler.
- One cancels the order automatically by triggering
The flow of method calls is illustrated in the diagram below.
Create the Factor Calculation Engine:
createFactorCalEngine defines the creation and
computation logic of the factor calculation engine, and specifies the
schemata of the input table and the output table. It also sets the engine's
metrics, including the ratio of the latest transaction price to the lowest
transaction price within 15 seconds (ROC), the cumulative transaction volume
over 1 minute, and the latest transaction price. A reactive state engine is
created.
def createFactorCalEngine(){
    dummyTable = table(1:0, `securityid`time`price`volume,
    `STRING`TIMESTAMP`DOUBLE`INT)
    metrics = [<(price\tmmin(time, price, 15s)-1)*100>, <tmsum(time, volume, 60s)>,
    <price> ]
    factorResult = table(1:0, `securityid`ROC`volume`lastPrice,
    `STRING`INT`LONG`DOUBLE)
    createReactiveStateEngine(name="factorCal", metrics=metrics ,
    dummyTable=dummyTable, outputTable=factorResult, keyColumn=`securityid,
    outputHandler=handleFactorCalOutput, msgAsTable=true)
}
The script above creates a reactive state engine factorCal, which takes input
matching dummyTable's schema, calculates the metrics, then
passes the results to handleFactorCalOutput instead of
writing directly to the outputTable factorResult. The results are
formatted as a table matching factorResult's schema, as specified by
msgAsTable=true.
def handleFactorCalOutput(factorResult):
    factorSecurityid = factorResult.securityid[0]
    ROC = factorResult.ROC[0]
    volume = factorResult.volume[0]
    lastPrice = factorResult.lastPrice[0]
    updateDataViewItems(engine=self.dataview, keys=factorSecurityid,
    valueNames=["ROC","volume"], newValues=(ROC,volume))
    if (ROC > strategyParams[factorSecurityid][`ROCThreshold]
    and volume > strategyParams[factorSecurityid][`volumeThreshold]):
        orderid = self.strategyid+"_"+factorSecurityid+"_"+long(now())
        newOrder = NewOrder(orderid, factorSecurityid, lastPrice*0.98, 100, 'B', 0)
        emitEvent(newOrder) // Send order event externally
        newOrderNum = (exec newOrderNum from self.dataview where
        securityid=factorSecurityid)[0] + 1
        newOrderAmount = (exec newOrderAmount from self.dataview where
        securityid=factorSecurityid)[0] + lastPrice*0.98*10
        updateDataViewItems(engine=self.dataview, keys=factorSecurityid,
        valueNames=["newOrderNum", "newOrderAmount"],
        newValues=(newOrderNum, newOrderAmount)) // Update data view
        addEventListener(handler=self.execReportExceedTimeHandler{orderid,
        factorSecurityid}, eventType="ExecutionReport",
        condition=<ExecutionReport.orderid=orderid>, times=1, exceedTime=60s)
        addEventListener(handler=execReportHandler, eventType="ExecutionReport",
        condition=<ExecutionReport.orderid=orderid>, times="all") // Start execution report listening
    }
}
handleFactorCalOutput processes calculation results received
from the reactive state engine. It evaluates the ROC and cumulative
transaction volume factors agains the predefined threasholds. When
conditions are met, it performs the following operations:
- Creates an order ID using the strategy ID, stock code, and timestamp.
- Constructs an order event to buy 100 shares at 2% below the latest trade price.
- Sends the order event externally.
- Retrieves and updates order data and amounts in the data view. This will be covered separately in later sections.
- Adds two event listeners, both monitoring order executions:
- Execution report listener: When an execution report event is
detected, triggers the
execReportHandlermethod to query the order number and calculate execution amount, updating them to the data view. - Execution timeout listener: Uses times=1 and
exceedTime=60s to set a timeout timer - if no
execution report event is matched within 60 seconds (timeout),
triggers the
execReportExceedTimeHandlermethod once, sends a cancellation event externally, then updates the data view. If an execution report arrives before timeout, this event listener is removed.
- Execution report listener: When an execution report event is
detected, triggers the
def execReportExceedTimeHandler(orderid, exceedTimeSecurityid):
    emitEvent(CancelOrder(orderid)) # Send cancellation event externally
    timeoutOrderNum = (exec timeoutOrderNum from self.dataview
    where securityid=exceedTimeSecurityid)[0] + 1
    updateDataViewItems(engine=self.dataview, keys=exceedTimeSecurityid,
    valueNames=`timeoutOrderNum, newValues=timeoutOrderNum) # Update data view
}

def execReportHandler(execReportEvent):
    executionAmount = (exec executionAmount from self.dataview
    where securityid=execReportEvent.securityid)[0] +
    execReportEvent.price*execReportEvent.volume
    executionOrderNum = (exec executionOrderNum from self.dataview
    where securityid=execReportEvent.securityid)[0] + 1
    updateDataViewItems(engine=self.dataview, keys=execReportEvent.securityid,
    valueNames=["executionAmount","executionOrderNum"],
    newValues=(executionAmount,executionOrderNum)) # Update data view
}
Start event listener:
onload initializes an event listener monitoring StockTick
events. When the stock ID in the event matches the stock ID that the
strategy is set to monitor, it calls the tickHandler
method. tickHandler is defined as follows:
def tickHandler(tickEvent){
	factorCalEngine = getStreamEngine(`factorCal)
	insert into factorCalEngine values([tickEvent.securityid,
	tickEvent.time, tickEvent.price, tickEvent.volume])
}
tickHandler obtains the factor calculation engine's handle
using the getStreamEngine function, then ingests data into
the engine. The data consists of the stock ID, time, price and volume from
qualifying StockTick events captured by the event listener.
3.2.3 Create CEP Engine
dummy = table(array(STRING, 0) as eventType, array(BLOB, 0) as eventBody)
share(streamTable(array(STRING, 0) as eventType, array(BLOB, 0) as eventBody,
array(STRING, 0) as orderid), "output")
outputSerializer = streamEventSerializer(name=`serOutput,
eventSchema=[NewOrder,CancelOrder], outputTable=objByName("output"),
commonField="orderid")
strategyid = 1
strategyParams = dict(`300001`300002`300003,
[dict(`ROCThreshold`volumeThreshold, [1,1000]),
dict(`ROCThreshold`volumeThreshold, [1,2000]),
dict(`ROCThreshold`volumeThreshold, [2, 5000])])
engine = createCEPEngine(name='strategyDemo', monitors=<StrategyMonitor(strategyid,
strategyParams)>, dummyTable=dummy, eventSchema=[StockTick,ExecutionReport],
outputTable=outputSerializer)createCEPEnginecreates a CEP engine.- The StrategyMonitor class is specified as the monitor for the CEP engine. strategyid and strategyParams are passed to instantiate the monitor.
- The schema of the engine’s input is defined through the table dummy. The eventType column represents the event type, and the eventBody column holds the serialized event data. A shared stream table, output, is specified as the output table for the CEP engine.
- Serialized data entering the engine will be deserialized according to
the event schema defined in the engine's eventSchema parameter.
In this example, we use
appendEventto directly ingest events into the engine, bypassing the deserialization step. - Since the monitor invokes
emitEvent, the outputTable parameter ofcreateCEPEnginemust be an event serializer. To achieve this, an event serializer object is created usingstreamEventSerializer, which serializes the events generated byemitEventinto BLOB format and writes them to a heterogeneous stream table called "output." The eventSchema parameter ofstreamEventSerializerdefines the schemata for the emitted events during serialization.
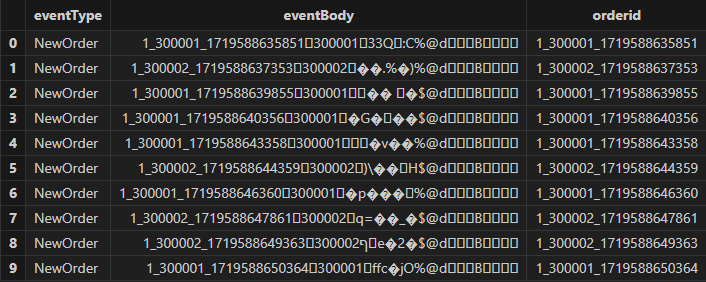
3.2.4 Ingest Simulated Data into the Engine
Construct StockTick event instances and ingest them into the CEP engine using
appendEvent.
ids = `300001`300002`300003`600100`600800
for (i in 1..120) {
    sleep(500)
    tick = StockTick(rand(ids, 1)[0], now()+1000*i,
10.0+rand(1.0,1)[0], 100*rand(1..10, 1)[0])
    getStreamEngine(`strategyDemo).appendEvent(tick)
}
We define some stock codes and generate 120 ticks. During each loop iteration, a StockTick instance is created to simulate a single transaction with details including the stock code, transaction time, transaction price, and volume. The generated StockTick event is sent to the CEP engine.
sleep(1000*20)
print("begin to append ExecutionReport")
for (orderid in (exec orderid from output where eventType="NewOrder")){
    sleep(250)
    if(not orderid in (exec orderid from output where eventType="CancelOrder")) {
        execRep = ExecutionReport(orderid, split(orderid,"_")[1], 10, 100)
        getStreamEngine(`strategyDemo).appendEvent(execRep)
    }
}sleep(1000*20)simulates a scenario where there are pending orders but no executions.- The script iterates through all new orders by querying the output table for all new order IDs. It checks whether the current order ID has been canceled. If it has not been canceled, an execution report event is generated.
View Results
The result table, output, contains the following columns:
- eventType: Displays the type of event sent to the output event queue.
- eventBody: Shows the serialized result of the event.
- orderid: An optional column used here as a unique identifier for individual order events.
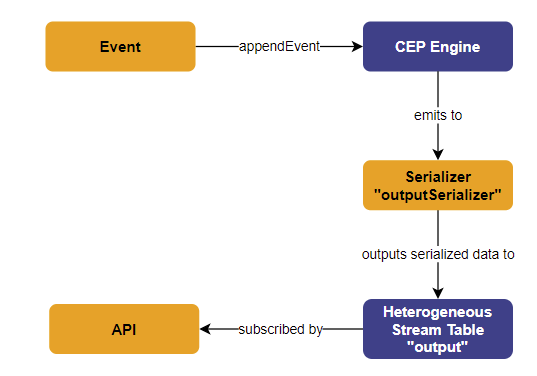
Let’s revisit the whole process:
- Events enter the CEP engine, where they are monitored by event listeners in the monitor. The corresponding callback functions are triggered.
- The output events are appended to the end of the engine's event output
queue via the
emitEventmethod. - These output events are then passed to outputSerializer, an event
serializer returned by the
streamEventSerializerfunction. This function is specified via the outputTable parameter of the CEP engine. - Finally, the serialized event data is written to the heterogeneous stream table output, where it can be accessed for subscription and deserialization by various API interfaces.
4. Data Views
In Case II, to conveniently monitor the latest status of data during strategy
execution, a data view engine is created in the onload method
during monitor initialization. This section explains the code for creating and
updating the data view in Case II.
A data view is a snapshot of specific data at a particular moment. In the CEP system, data views are used to continuously track and display the latest status of intermediate variables or metrics processed by the CEP engine. These metrics are typically triggered by events and dynamically updated during event processing, such as trading volumes, prices, and so on. Please note that the data view page only displays the latest snapshot of metrics and does not support viewing historical snapshots.
The data view engine is a special DolphinDB engine responsible for managing one or more data views. It allows the CEP engine to write metrics into these data views during operation. The data view engine saves the latest snapshot of each metric and is responsible for outputting the data to target tables (typically stream tables), making the data available for subscription or query by other programs. In the CEP system, multiple data view engines can be created, and the metrics to be maintained are specified during creation.
4.1 Initialize Data Views
The onload method calls initDataView to
initialize the data view.
def onload() {
    // Initialize data view
    initDataView()
    ...
}
The definition of initDataView is implemented within the
monitor.
def initDataView(){
    share(streamTable(1:0, `securityid`strategyid`ROCThreshold
`volumeThreshold`ROC`volume`newOrderNum`newOrderAmount`executionOrderNum
`executionAmount`timeoutOrderNum`updateTime,
`STRING`INT`INT`INT`INT`INT`INT`DOUBLE`INT`DOUBLE`INT`TIMESTAMP), "strategyDV")
    dataview = createDataViewEngine(name="Strategy_"+strategyid,
outputTable=objByName(`strategyDV), keyColumns=`securityId, timeColumn=`updateTime)
    num = strategyParams.size()
    securityids = strategyParams.keys()
    ROCThresholds = each(find{,"ROCThreshold"}, strategyParams.values())
    volumeThresholds = each(find{,"volumeThreshold"}, strategyParams.values())
    dataview.tableInsert(table(securityids, take(self.strategyid, num) as
strategyid, ROCThresholds, volumeThresholds, take(int(NULL), num) as ROC,
take(int(NULL), num) as volume, take(0, num) as newOrderNum,
take(0, num) as newOrderAmount, take(0, num) as executionOrderNum,
take(0, num) as executionAmount, take(0, num) as timeoutOrderNum))
}initDataViewfirst creates and shares a stream table called "strategyDV", which serves as the output table for the data view engine. strategyDV defines the schema of the output and specifies the metrics to be monitored.- The data view engine is created through
createDataViewEngine, which sets the engine's key. For each key value, the engine only retains the latest record. - The
eachhigher-order function appliesfindto each stock's strategy parameter dictionary, extracting the factor threshold values (“ROCThreshold” and “volumeThreshold”) for each stock. - Finally, the threshold values and initial values are inserted into the data view.
4.2 Update Values of Data View
updateDataViewItems is used to update values of a data view through keys. In this case example, it is used in multiple methods.
- Updating timeout order count: When an execution report event times out,
updateDataViewItemsincreases the number of timeout orders and updates the data view.def execReportExceedTimeHandler(orderid, exceedTimeSecurityid){ emitEvent(CancelOrder(orderid)) // Send cancel order event externally timeoutOrderNum = (exec timeoutOrderNum from self.dataview where securityid=exceedTimeSecurityid)[0] + 1 updateDataViewItems(engine=self.dataview, keys=exceedTimeSecurityid, valueNames=`timeoutOrderNum, newValues=timeoutOrderNum) // Update data view } - Updating execution amount and order count: After calculating the execution
amount and number of orders for a given securityid,
updateDataViewItemsupdates them in the data view.def execReportHandler(execReportEvent) { executionAmount = (exec executionAmount from self.dataview where securityid=execReportEvent.securityid)[0] + execReportEvent.price*execReportEvent.volume executionOrderNum = (exec executionOrderNum from self.dataview where securityid=execReportEvent.securityid)[0] + 1 updateDataViewItems(engine=self.dataview, keys=execReportEvent.securityid, valueNames=["executionAmount","executionOrderNum"], newValues=(executionAmount,executionOrderNum)) // Update data view } - Updating ROC and volume data: When the factor calculation engine outputs
results,
updateDataViewItemsupdates the related ROC and volume data.def handleFactorCalOutput(factorResult){ factorSecurityid = factorResult.securityid[0] ROC = factorResult.ROC[0] volume = factorResult.volume[0] lastPrice = factorResult.lastPrice[0] updateDataViewItems(engine=self.dataview, keys=factorSecurityid, valueNames=["ROC","volume"], newValues=(ROC,volume)) ...... } - Updating new order count and amount: When creating new orders,
updateDataViewItemsupdates the number of orders and order amount.if (ROC>strategyParams[factorSecurityid][`ROCThreshold] && volume >strategyParams[factorSecurityid][`volumeThreshold]) { ... newOrderNum = (exec newOrderNum from self.dataview where securityid=factorSecurityid)[0] + 1 newOrderAmount = (exec newOrderAmount from self.dataview where securityid=factorSecurityid)[0] + lastPrice*0.98*10 updateDataViewItems(engine=self.dataview, keys=factorSecurityid, valueNames= ["newOrderNum", "newOrderAmount"], newValues=(newOrderNum, newOrderAmount)) // Update data view ... }
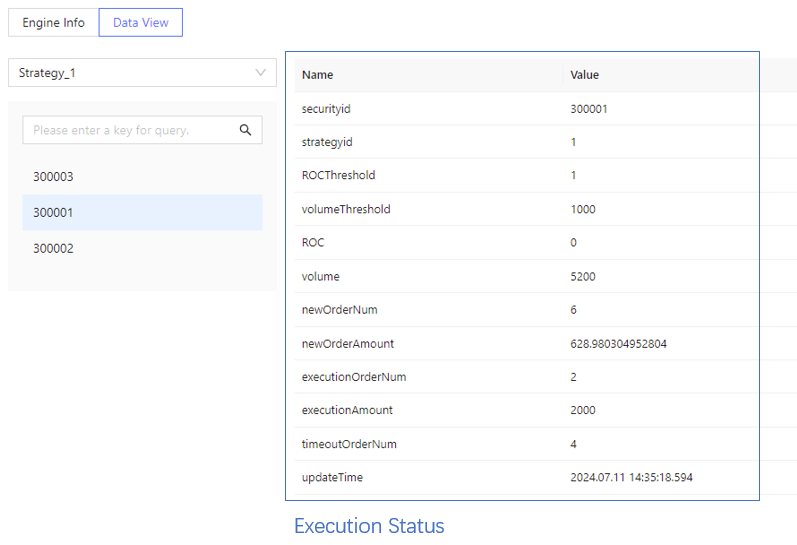
The state of the data view at a certain point during strategy execution is shown in the figure below.
5. Summary
This article introduces DolphinDB's CEP (complex event processing) engine, covering key concepts like complex events and event listeners. We explore two use cases to demonstrate its capabilities. In Case I, we implemented a basic CEP engine to monitor market data and log events, highlighting the essential steps and modules. In Case II, we developed an event-driven price-volume strategy, integrating DolphinDB's reactive state engine for high-performance real-time calculations. Additionally, we explained how to configure scheduled tasks and send events externally.
6. Appendices
Complete script for Case I: Monitoring Stock Prices and Logging
Complete script for Case II: Implementing a Basic High-Frequency Price-Volume Factor Strategy