
DolphinDB Exporter 集群监控最佳实践
在读写、查询等高并发场景中,及时了解系统资源的使用情况有助于快速定位性能瓶颈。本教程提供针对多 DolphinDB 服务器(或单服务器)及 高可用集群(或单节点)资源的监控和告警方案。教程基于 DolphinDB Exporter、Prometheus、Grafana 及 dolphindb-datasource-next 插件实现完整的监控体系。
阅读本教程前需部署 DolphinDB Server。建议部署 DolphinDB Server 3.00.4 及以上版本,以支持所有 DolphinDB Exporter 指标。各指标所支持的最低 DolphinDB Server 版本,可参考 6. 附录。
1. 监控方案概述
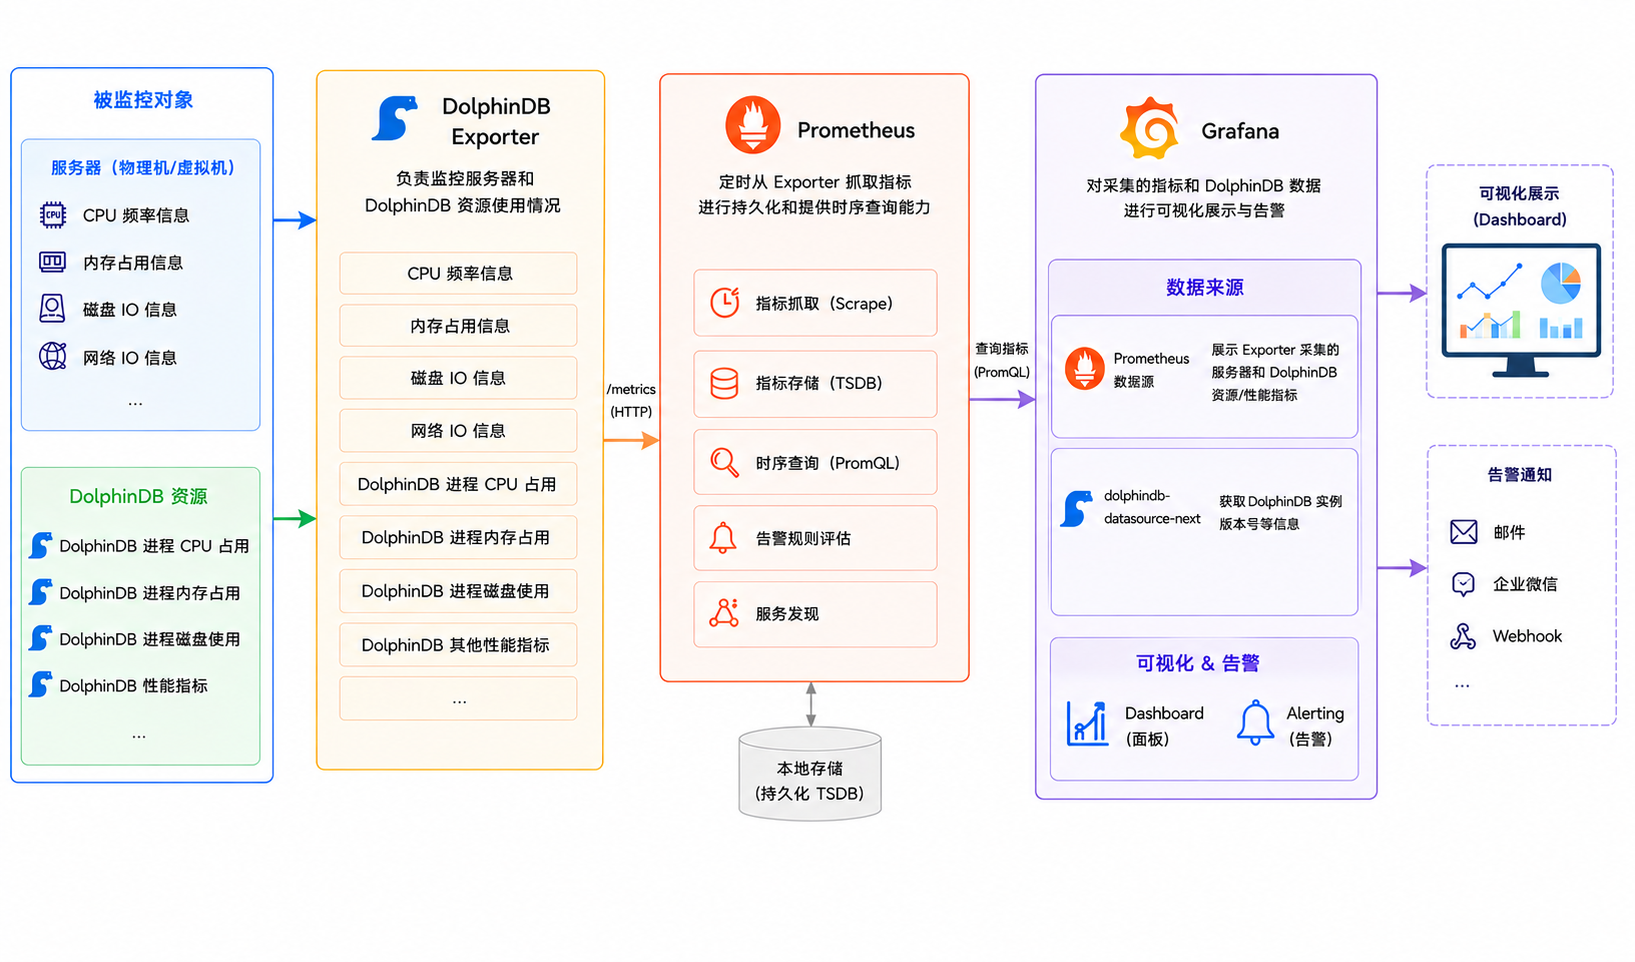
本方案通过 DolphinDB Exporter + Prometheus + Grafana + dolphindb-datasource-next 监控服务器、DolphinDB 资源和 DolphinDB 集群节点状态等信息。方案架构图如下所示:
-
DolphinDB Exporter 是 DolphinDB 为 Prometheus 生态开发的指标导出工具。负责监控服务器和 DolphinDB 资源使用情况,如下:
-
服务器信息:CPU 频率信息、内存占用信息、磁盘 IO 信息、网络 IO 信息、DolphinDB 性能等。
-
DolphinDB 资源使用情况:DolphinDB 进程 CPU 占用、DolphinDB 进程内存占用、DolphinDB 进程磁盘资源使用等。
-
-
DolphinDB 开发了 dolphindb-datasource-next 插件,支持在 Grafana 数据面板(Dashboard)中通过编写查询脚本与 DolphinDB 进行交互,实现 DolphinDB 监控数据的可视化。本方案中,Grafana 直接连接 DolphinDB 服务,通过查询脚本展示数据库信息。
-
Prometheus 负责定时采集 DolphinDB Exporter 相关指标并进行持久化,以及提供相关指标的时序查询能力。
-
Grafana 负责对 Prometheus 采集的指标信息和 dolphindb-datasource-next 查询结果进行可视化展示以及提供告警能力。
2. 软件安装与启动
本章节主要介绍如何安装和启动本监控方案所需的三大核心组件,包括:
-
DolphinDB Exporter:介绍 DolphinDB Exporter 的下载、安装、启动方法及关键参数配置,该组件负责采集服务器资源指标(CPU、内存、磁盘、网络)及 DolphinDB 运行时指标。
-
Prometheus:介绍 Prometheus 的安装、配置文件(prometheus.yml)的修改要点,以及如何通过 http_sd_configs 动态发现 DolphinDB Exporter 指标,实现指标的定时抓取与告警规则加载。
-
Grafana:介绍 Grafana 的安装、dolphindb-datasource-next 插件的配置方法,以及如何导入预设 Dashboard(dolphindb-overview.json)实现监控数据的可视化展示。
2.1 DolphinDB Exporter
DolphinDB Exporter 是 DolphinDB 提供的一个可以采集服务器信息和 DolphinDB 信息的应用程序,它能采集服务器的 CPU、内存、磁盘、网络以及 DolphinDB 相关指标等信息。
2.1.1 安装
-
单击官方链接下载对应版本软件包:
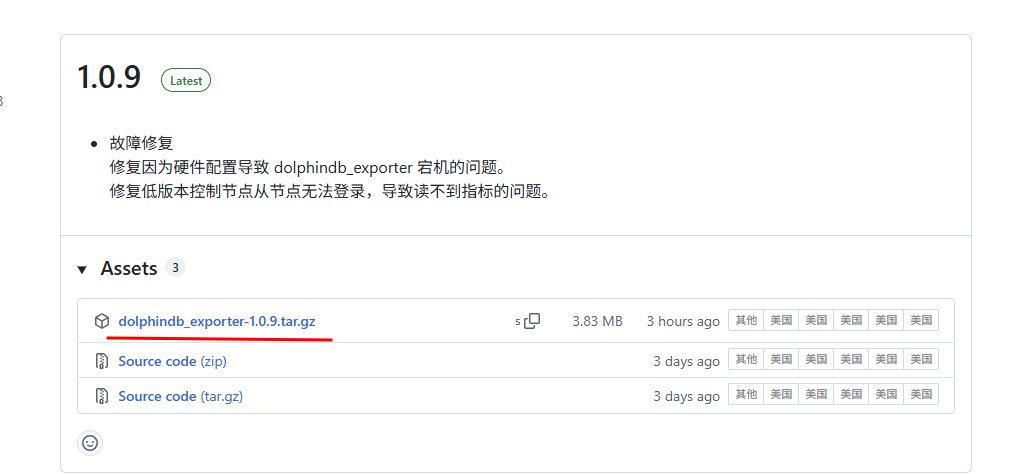
图 2. 图 2-1 DolphinDB Exporter 下载 -
将软件包传输至服务器并解压。
建议安装目录为 <DolphinDB 安装目录>/clusterDemo/dolphindb_exporter,安装完成后,可直接运行软件包内的 startExporter.sh 实现后台启动。
2.1.2 启动
-
配置环境变量。
-
DOLPHINDB_USERNAME:DolphinDB 用户名。默认为 admin。
-
DOLPHINDB_PASSWORD:DolphinDB 密码。默认为 123456。
注:建议创建一个管理员用户专门给 DolphinDB Exporter 使用,例如:
createUser("dolphindb_exporter", "123456", isAdmin=true)。出于安全考虑,建议每次启动 DolphinDB Exporter 前,在 Shell 中配置环境变量:
# 关闭历史记录 export HISTSIZE=0 # dolphindb_exporter 环境变量 export DOLPHINDB_USERNAME="dolphindb_exporter" export DOLPHINDB_PASSWORD="123456" #修改用户对应的密码 #重新开启历史记录 export HISTSIZE=1000 -
-
执行启动脚本。
cd clusterDemo/dolphindb_exporter
bash startExporter.sh
# 默认使用 8000 端口,如果需要指定端口号,可以添加参数
# bash startExporter.sh 8001
该启动脚本会根据 ../config 目录下的配置文件监控本机节点。若集群的配置文件位于其他目录中,需要修改脚本内的
-config-dir参数或者参考以下命令将第二个参数设置为实际的配置文件目录。bash startExporter.sh 8000 ../../config若监控单节点,需要修改 config 文件夹中的 cluster.nodes 文件,其 mode 为 single,例如:
localSite,mode,computeGroup,zone
192.xxx.xxx.xx:8848:local8848,single,,
启动后将在当前目录中生成日志文件 dolphindb_exporter.log。
2.1.3 关键参数
-
-collect.<scraper_name>:是否收集特定类别的指标(默认:true),其中<scraper_name>为指标类别,可通过--help查看所有指标类别。 -
-config-dir:配置文件目录(默认:"config")。-
包含 DolphinDB 集群配置的目录。
-
配置文件应与 DolphinDB 集群配置一致。
-
-
-listen-port:监听端口号(默认:8000)。 -
-local-ip-only:是否仅监控本机节点(默认:false)。-
启用后只采集运行 DolphinDB Exporter 的机器上的 DolphinDB 节点指标。
-
startExporter.sh 启动脚本里面已经设置为 true。
-
只获取 DolphinDB 指标的场景,可以只在一台服务器上部署 DolphinDB Exporter。此时设置该参数为 false。
-
-
-log-level:日志等级(默认:info),可选值为 debug 、info、warn、error。 -
-pool-size:每个 DolphinDB 节点的连接池大小(默认:10),注意不要配置过大,避免超过 DolphinDB 的最大连接数。 -
-reconnect-num:连接池重连次数(默认:2),每次 Prometheus 拉取时,DolphinDB Exporter 连接 DolphinDB 失败重试次数,若超过失败次数,此次拉取就不返回指标。 -
-version:显示版本信息并退出。 -
-help:显示帮助信息。
2.2 Prometheus
Prometheus 是一个开源的系统监控和告警工具包,许多公司和组织都采用了 Prometheus,该项目拥有非常活跃的开发者和用户社区。Prometheus 将其指标作为时间序列数据收集和存储,即指标信息与记录时的时间戳以及可选的键值对(称为标签)一起存储。在本方案中,Prometheus 负责从数据源定时抓取数据。
2.2.1 安装
-
访问官网 Prometheus Server,下载对应版本的软件包:
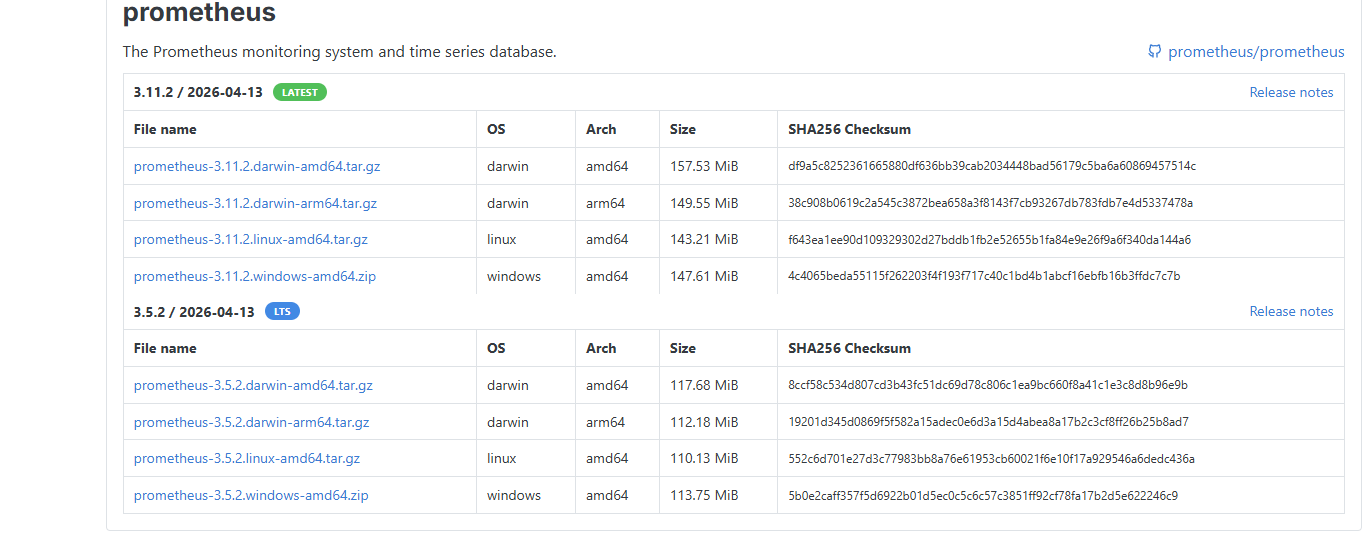
图 3. 图 2-2 Prometheus 下载 -
将软件包传输至服务器并进行解压,可看到如下目录结构:
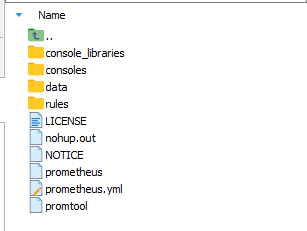
图 4. 图 2-3 Prometheus 目录结构 其中,data 是数据的存储路径,prometheus.yml 是 Prometheus 的配置文件。启动 Prometheus 服务时,会默认加载当前路径下的 prometheus.yml 文件,若配置文件不在当前目录下,可通过
--config.file指定。
2.2.2 启动
-
编辑配置文件。
复制 dolphindb_exporter 安装包里面的 rules.yaml 和 alerts.yaml 文件到 Prometheus 安装目录下(也可以将 Prometheus 配置文件里的 rule_files 设置为实际的文件路径)。
修改 Prometheus 配置文件(默认位于 <Prometheus 安装目录/prometheus.yml),添加
rule_files和scrape_configs。rule_files: - "./rules.yaml" # 需要修改为实际路径 - "./alerts.yaml" # 需要修改为实际路径 scrape_configs: - job_name: "dolphindb_exporter_targets_<MACHINE-ID>" # 需要唯一 http_sd_configs: - url: http://<DOLPHINDB-EXPORTER-HOSTNAME>:8000/targets # 需要修改为实际地址 refresh_interval: 1m metrics_path: /probe relabel_configs: - source_labels: [__address__] target_label: __param_target - source_labels: [__param_target] target_label: instance - target_label: __address__ replacement: <DOLPHINDB-EXPORTER-HOSTNAME>:8000 # 需要修改为实际地址 - job_name: 'dolphindb_exporter_<MACHINE-ID>' # 需要唯一 static_configs: - targets: [<DOLPHINDB-EXPORTER-HOSTNAME>:8000] # 需要修改为实际地址 - job_name: 'dolphindb_exporter_machine_<MACHINE-ID>' # 需要唯一 static_configs: - targets: [<DOLPHINDB-EXPORTER-HOSTNAME>:8000] # 需要修改为实际地址 metrics_path: /machine_metrics注:-
需要修改 <MACHINE-ID> 为自定义的机器 ID,使得多台机器的每个 job_name 唯一,例如
job_name:
                                                "dolphindb_exporter_targets_1"
。 -
需要修改 <DOLPHINDB-EXPORTER-HOSTNAME> 为 DolphinDB Exporter 所在的服务器地址。
-
需要修改 rules.yaml 和 alerts.yaml 的路径为实际路径。
-
以上只是单台机器的配置,多台机器配置可以复制 scrape_configs 部分内容,然后修改<MACHINE-ID> 和 <DOLPHINDB-EXPORTER-HOSTNAME>。
完整示例
# my global config global: scrape_interval: 15s # Set the scrape interval to every 15 seconds. Default is every 1 minute. evaluation_interval: 15s # Evaluate rules every 15 seconds. The default is every 1 minute. # scrape_timeout is set to the global default (10s). # Alertmanager configuration alerting: alertmanagers: - static_configs: - targets: # - alertmanager:9093 # Load rules once and periodically evaluate them according to the global 'evaluation_interval'. rule_files: - "./rules.yaml" # 需要修改为实际路径 - "./alerts.yaml" # 需要修改为实际路径 # A scrape configuration containing exactly one endpoint to scrape: # Here it's Prometheus itself. scrape_configs: # The job name is added as a label `job=<job_name>` to any timeseries scraped from this config. - job_name: "prometheus" # metrics_path defaults to '/metrics' # scheme defaults to 'http'. static_configs: - targets: ["localhost:9090"] # The label name is added as a label `label_name=<label_value>` to any timeseries scraped from this config. labels: app: "prometheus" - job_name: "dolphindb_exporter_targets_43" # 需要唯一 http_sd_configs: - url: http://192.168.100.43:8000/targets # 需要修改为实际地址 refresh_interval: 1m metrics_path: /probe relabel_configs: - source_labels: [__address__] target_label: __param_target - source_labels: [__param_target] target_label: instance - target_label: __address__ replacement: 192.168.100.43:8000 # 需要修改为实际地址 - job_name: 'dolphindb_exporter_43' # 需要唯一 static_configs: - targets: [192.168.100.43:8000] # 需要修改为实际地址 - job_name: 'dolphindb_exporter_machine_43' # 需要唯一 static_configs: - targets: [192.168.100.43:8000] # 需要修改为实际地址 metrics_path: /machine_metrics - job_name: "dolphindb_exporter_targets_44" # 需要唯一 http_sd_configs: - url: http://192.168.100.44:8000/targets # 需要修改为实际地址 refresh_interval: 1m metrics_path: /probe relabel_configs: - source_labels: [__address__] target_label: __param_target - source_labels: [__param_target] target_label: instance - target_label: __address__ replacement: 192.168.100.44:8000 # 需要修改为实际地址 - job_name: 'dolphindb_exporter_44' # 需要唯一 static_configs: - targets: [192.168.100.44:8000] # 需要修改为实际地址 - job_name: 'dolphindb_exporter_machine_44' # 需要唯一 static_configs: - targets: [192.168.100.44:8000] # 需要修改为实际地址 metrics_path: /machine_metrics - job_name: "dolphindb_exporter_targets_45" # 需要唯一 http_sd_configs: - url: http://192.168.100.45:8000/targets # 需要修改为实际地址 refresh_interval: 1m metrics_path: /probe relabel_configs: - source_labels: [__address__] target_label: __param_target - source_labels: [__param_target] target_label: instance - target_label: __address__ replacement: 192.168.100.45:8000 # 需要修改为实际地址 - job_name: 'dolphindb_exporter_45' # 需要唯一 static_configs: - targets: [192.168.100.45:8000] # 需要修改为实际地址 - job_name: 'dolphindb_exporter_machine_45' # 需要唯一 static_configs: - targets: [192.168.100.45:8000] # 需要修改为实际地址 metrics_path: /machine_metrics -
-
启动 Prometheus。
执行以下命令启动 Prometheus:
nohup ./prometheus --config.file=prometheus.yml --web.listen-address=":9090" &注:启动 Prometheus 前,检查默认端口是否已被占用。Prometheus 默认使用 9090 端口;若该端口已被占用,需要同时修改 Prometheus 配置文件和启动参数中的端口。
在 prometheus.yml 的 scrape_configs 中,找到 job_name 为 prometheus 的配置项,并修改其下方 targets 中的端口号。随后,将上述启动命令中的 web.listen-address 参数也修改为相同的端口。
2.3 Grafana
Grafana 是一个开源的可视化和监控工具,广泛应用于数据分析和系统监控。它支持从多种数据源中获取数据,并通过动态仪表盘进行实时展示和分析。虽然 Prometheus 提供了快速验证 PromQL 以及临时可视化支持的功能,但其可视化功能较弱,而 Grafana 提供了强大的可视化功能,只需配置好 Prometheus 数据源,便能实现对 Prometheus 的可视化。故本方案采用 Grafana 作为可视化和告警组件。
2.3.1 安装
-
从官网下载对应版本的软件包(本教程使用的版本为 Grafana Enterprise 13.0.1),官网提供了不同系统的安装包,本教程使用 Standalone Linux Binaries 安装包作为示例,其他安装包的安装方法见官网文档。
-
解压安装包。
-
下载 DolphinDB 提供的 dolphindb-datasource-next 插件,并且解压到 Grafana 的 data/plugins/dolphindb-datasource-next 目录中(如果 Grafana 是通过 Linux 软件包安装的,插件的安装目录通常为 /var/lib/grafana/plugins/),如果没有 plugins 文件夹需要自行创建并且在该文件夹中创建 dolphindb-datasource-next 文件夹。
-
修改 Grafana 配置文件(conf/defaults.ini),使其允许加载未签名的 dolphindb-datasource-next 插件。每次修改配置项后,需重启 Grafana。
推荐阅读 Grafana 配置说明文档,然后打开并编辑配置文件。
在
[plugins]部分下面取消注释allow_loading_unsigned_plugins,并配置为dolphindb-datasource-next,例如:修改前:
# Enter a comma-separated list of plugin identifiers to identify plugins to load even if they are unsigned. Plugins with modified signatures are never loaded.
;allow_loading_unsigned_plugins =
修改后:
# Enter a comma-separated list of plugin identifiers to identify plugins to load even if they are unsigned. Plugins with modified signatures are never loaded.
allow_loading_unsigned_plugins = dolphindb-datasource-next
2.3.2 启动
在 Grafana 安装目录的 bin 文件夹中执行以下命令(如果 Grafana 是通过 Linux 软件包安装的,可以使用 systemd 方法启动,详情参考 Install Grafana | Grafana documentation):
nohup ./grafana server &默认端口为 3000,如果被占用需要修改配置文件中的 http_port 参数。
2.3.3 数据源配置
-
在浏览器中访问
http://IP:Port,进入到 Grafana 登录页面。
图 5. 图 2-4 Grafana 登录页面 默认的账号密码是 admin/admin,登录成功后如下所示:
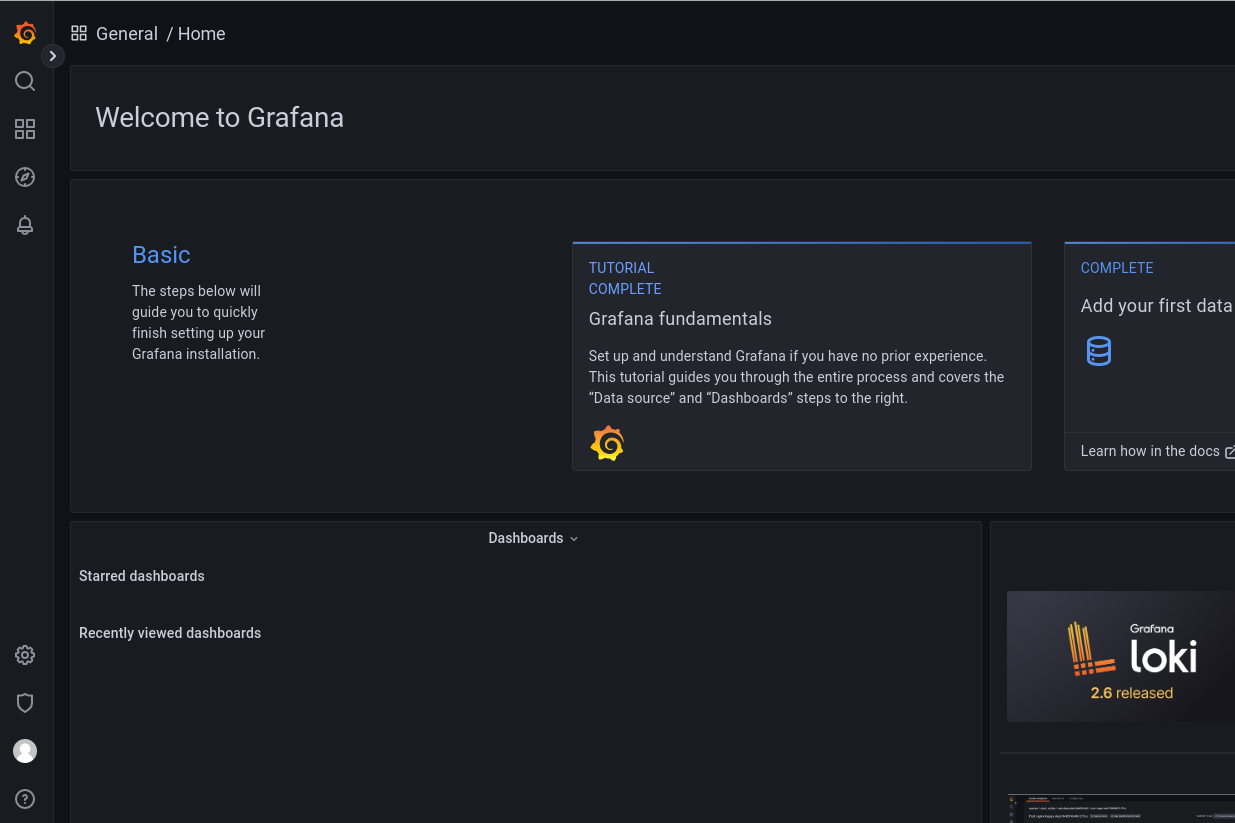
图 6. 图 2-5 Grafana Home 页面 -
配置 Prometheus 数据源。
-
在左侧导航栏中单击 Connections > Data sources,进入数据源添加界面。
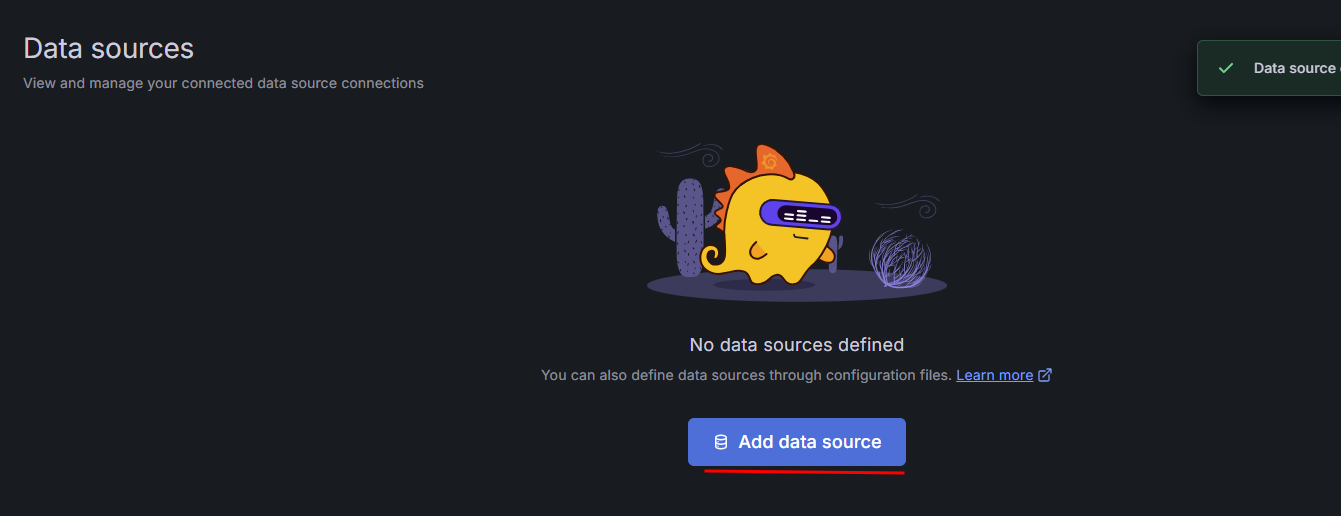
图 7. 图 2-6 配置 Prometheus 数据源 1 -
单击 Add data source。
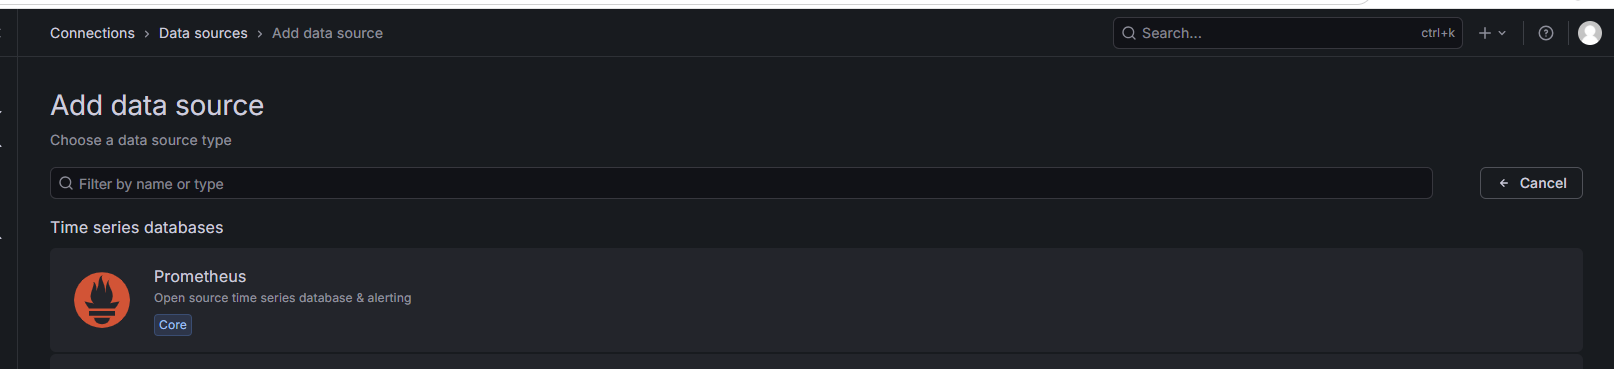
图 8. 图 2-7 配置 Prometheus 数据源 2 -
选择 Prometheus,进入数据源配置页面。在 Prometheus server URL 输入框中填写 Prometheus 服务器的 IP 和端口(其他设置保持默认)。
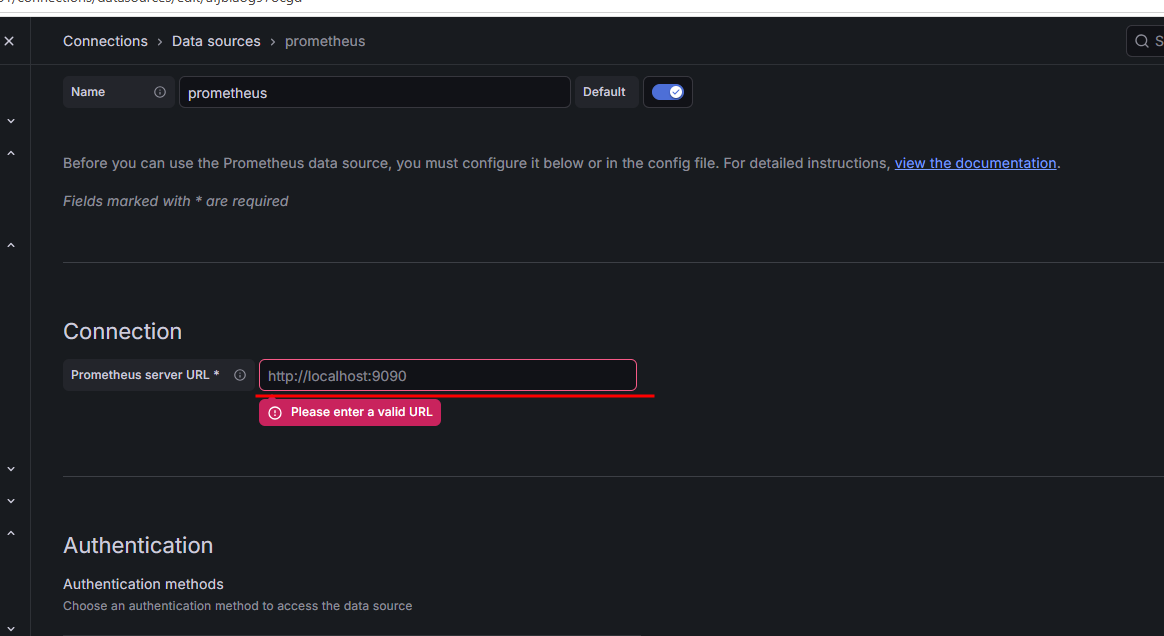
图 9. 图 2-8 配置 Prometheus 数据源 3 -
单击 Save & test。若出现了 Successfully queried the Prometheus API 说明数据源连接成功;若连接失败,检查 Prometheus 端口是否被占用。

图 10. 图 2-9 配置 Prometheus 数据源 4
-
-
配置 dolphindb-datasource-next 数据源。
-
在 Add data source 页面的搜索框中输入 DolphinDB,单击 Dolphindb-Datasource。
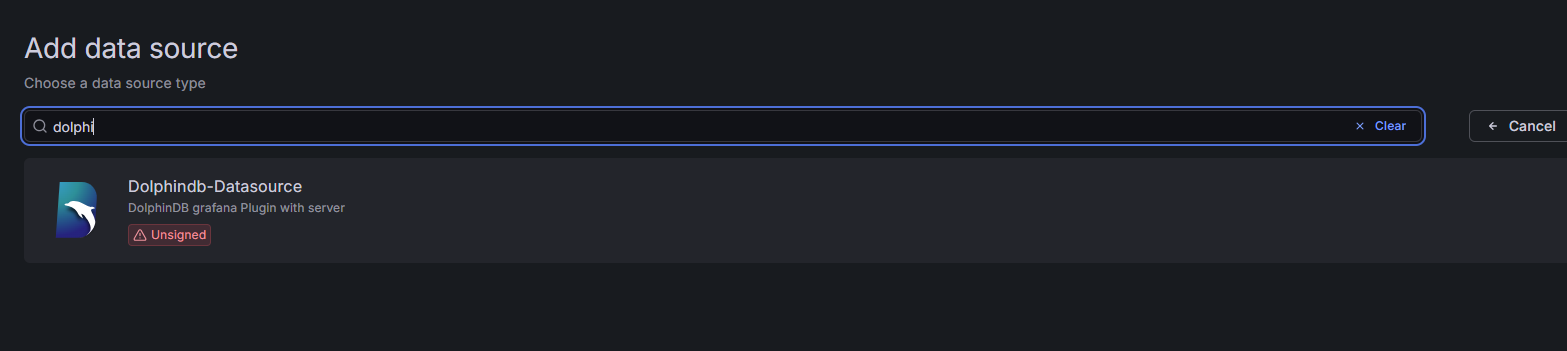
图 11. 图 2-10 配置 dolphindb-datasource-next 数据源 1 -
填写 DolphinDB 数据节点 IP 和端口以及管理员用户等信息。
-
单击 Save & test。若出现 Data source is working,说明成功连接到 DolphinDB。
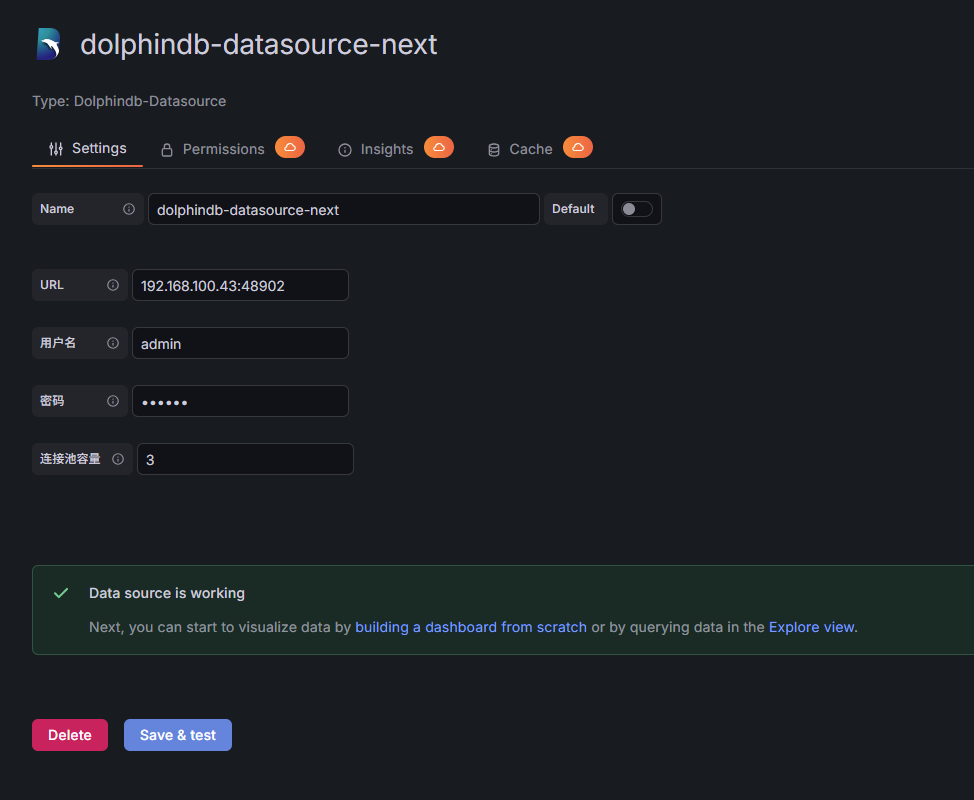
图 12. 图 2-13 配置 dolphindb-datasource-next 数据源 2
-
-
配置数据面板。
-
在 Dashboards 页面的右上角单击 New > Import。
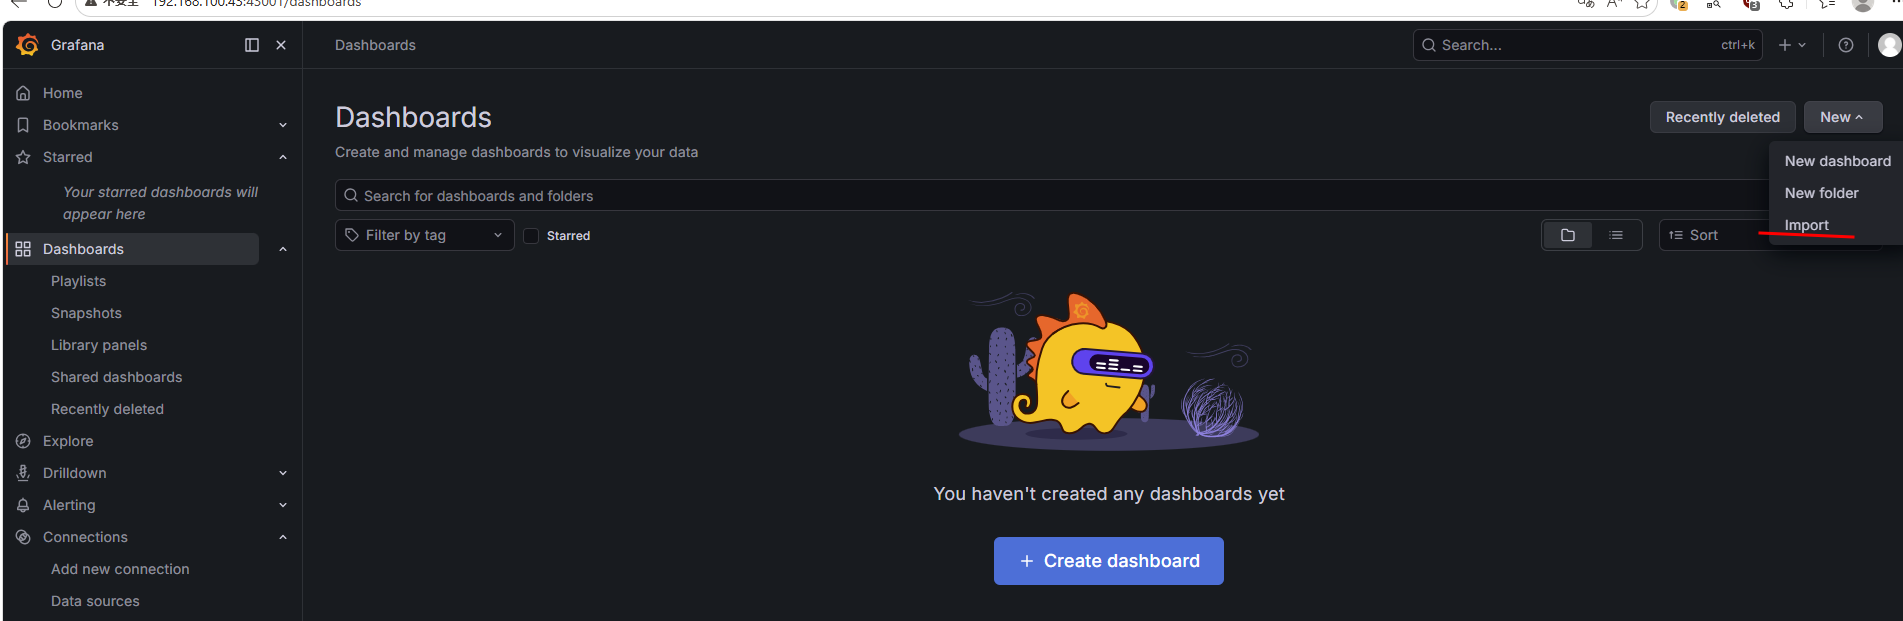
图 13. 图 2-14 配置 Dashboards 面板 1 -
上传 DolphinDB Exporter 安装包中的 dolphindb-overview.json 文件,单击 Import。
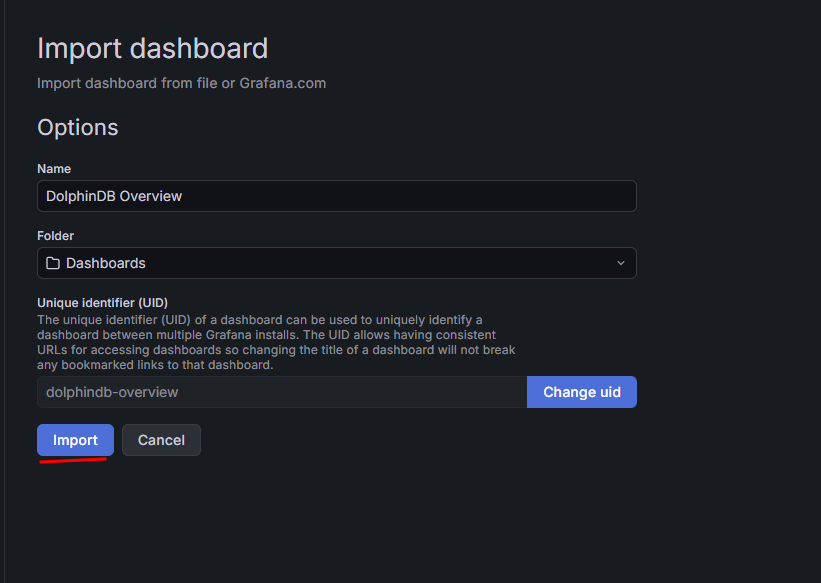
图 14. 图 2-15 配置 Dashboards 面板 2 -
自动跳转到新导入的面板:
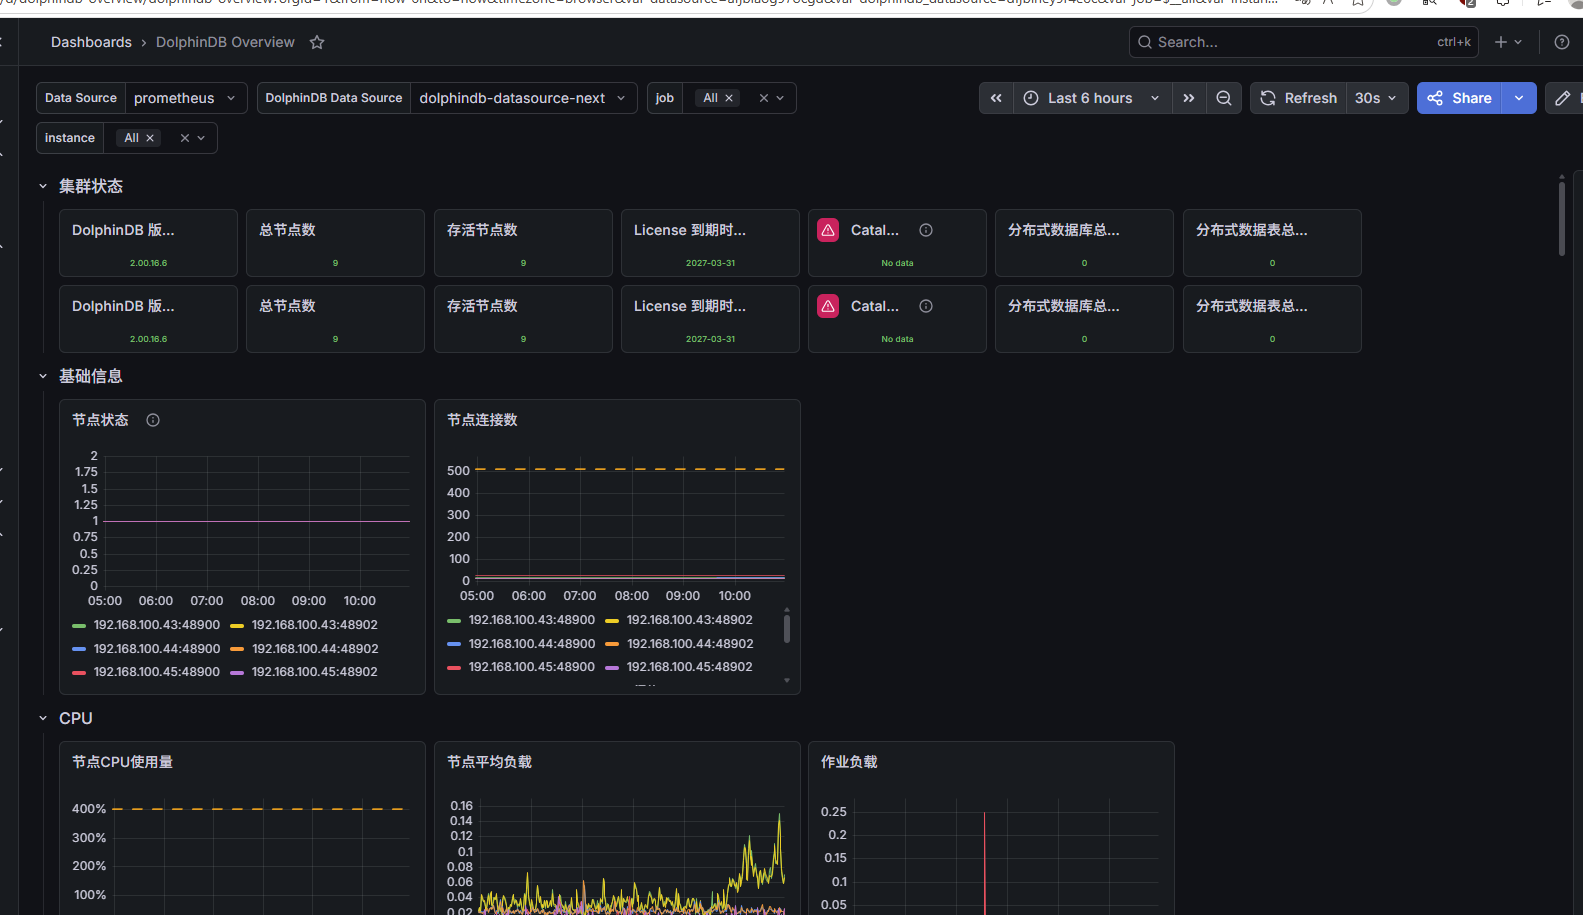
图 15. 图 2-16 配置 Dashboards 面板 3
-
3. 告警
本章主要讲解如何在 Grafana 中配置告警,实现自动获取异常监控指标信息,涵盖邮件和企业微信两种主流告警方式。
3.1 邮件告警
Grafana 的告警功能丰富,可以设置邮件、企业微信等多种方式的告警。本节主要介绍如何设置邮件告警。
3.1.1 修改配置文件
启用邮件告警功能,需修改 Grafana 的配置文件中的[smtp]。
-
打开 defaults.ini(默认路径为 /grafana/conf/defaults.ini),找到
[smtp]选项,按如下说明进行修改:-
将
enabled设置为 true,表示开启邮件通道。 -
将
host设置为告警邮箱所在的服务器。例如,以 163 邮箱作为告警邮箱,则host应为smtp.163.com:465。 -
将
user设置为接收告警信息的邮箱地址,password处需要填写授权码(自行在对应邮箱的官网申请),而不是user的登录密码,内网邮箱一般只需要密码即可,请按实际情况填写。
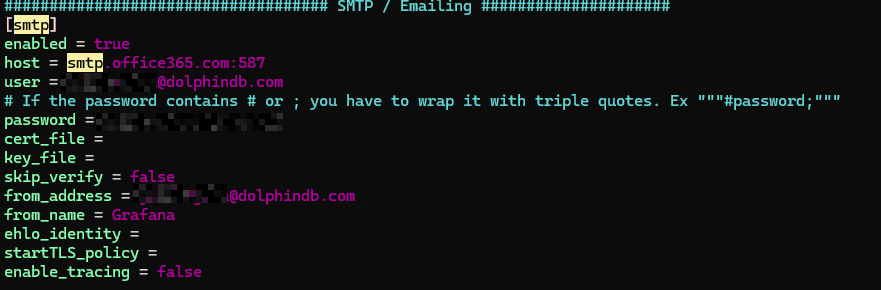
图 16. 图 3-1 修改 Grafana 配置文件 1 -
-
找到
[server]选项,将http_addr和domain修改为 Grafana 服务器的公网 IP。告警邮件里面的跳转地址会改成root_url对应的地址。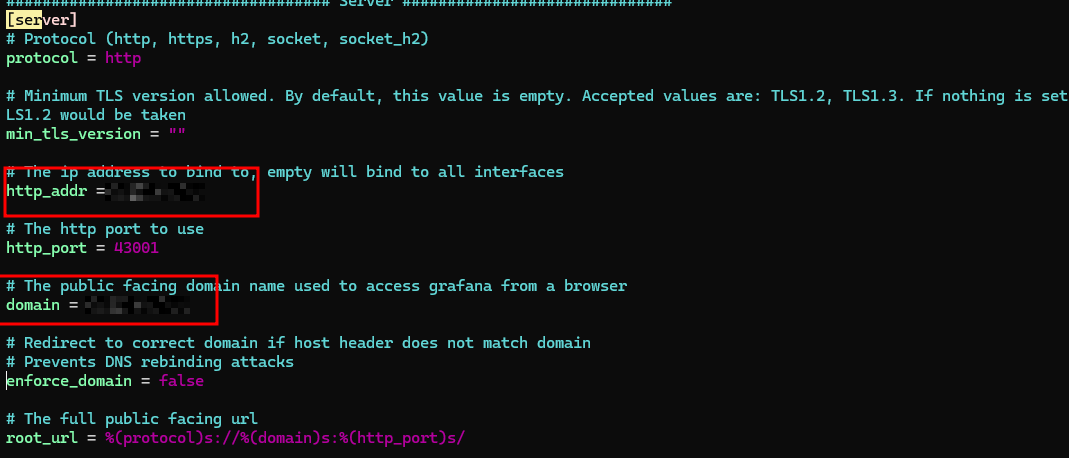
图 17. 图 3-2 修改 Grafana 配置文件 2 -
重启 Grafana 。
3.1.2 配置告警
Grafana 中的 Alert 模块提供了告警功能,使用告警功能时,需要在 Alert rules 模块中添加告警规则。Alert rules 主要作用为:对指标进行监控,当指标触发告警条件时,进行告警处理。一个告警规则至少要包含告警条件和告警评估。
添加通知方式
-
在左侧导航栏单击 Alerting > Notification configuration,在 Contact points 页签中单击 New contact point。
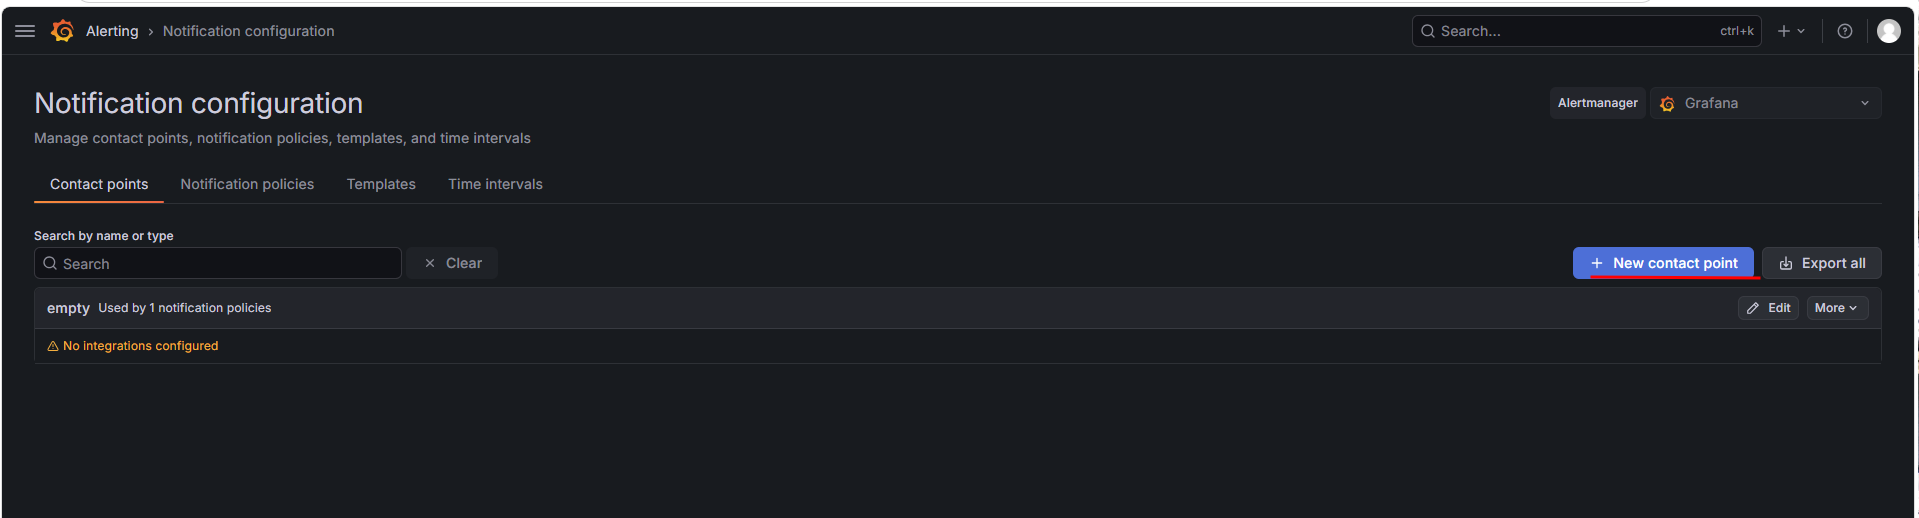
图 18. 图 3-3 添加通知方式 1 -
选择 email 集成方式并填写相关信息,单击 Save contact point。
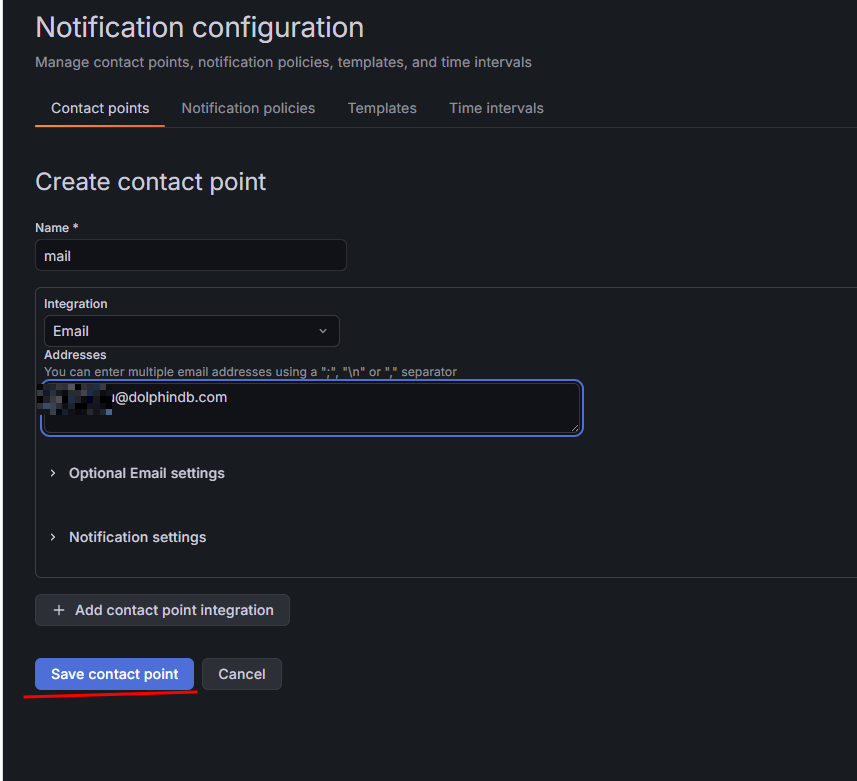
图 19. 图 3-4 添加通知方式 2
添加告警规则
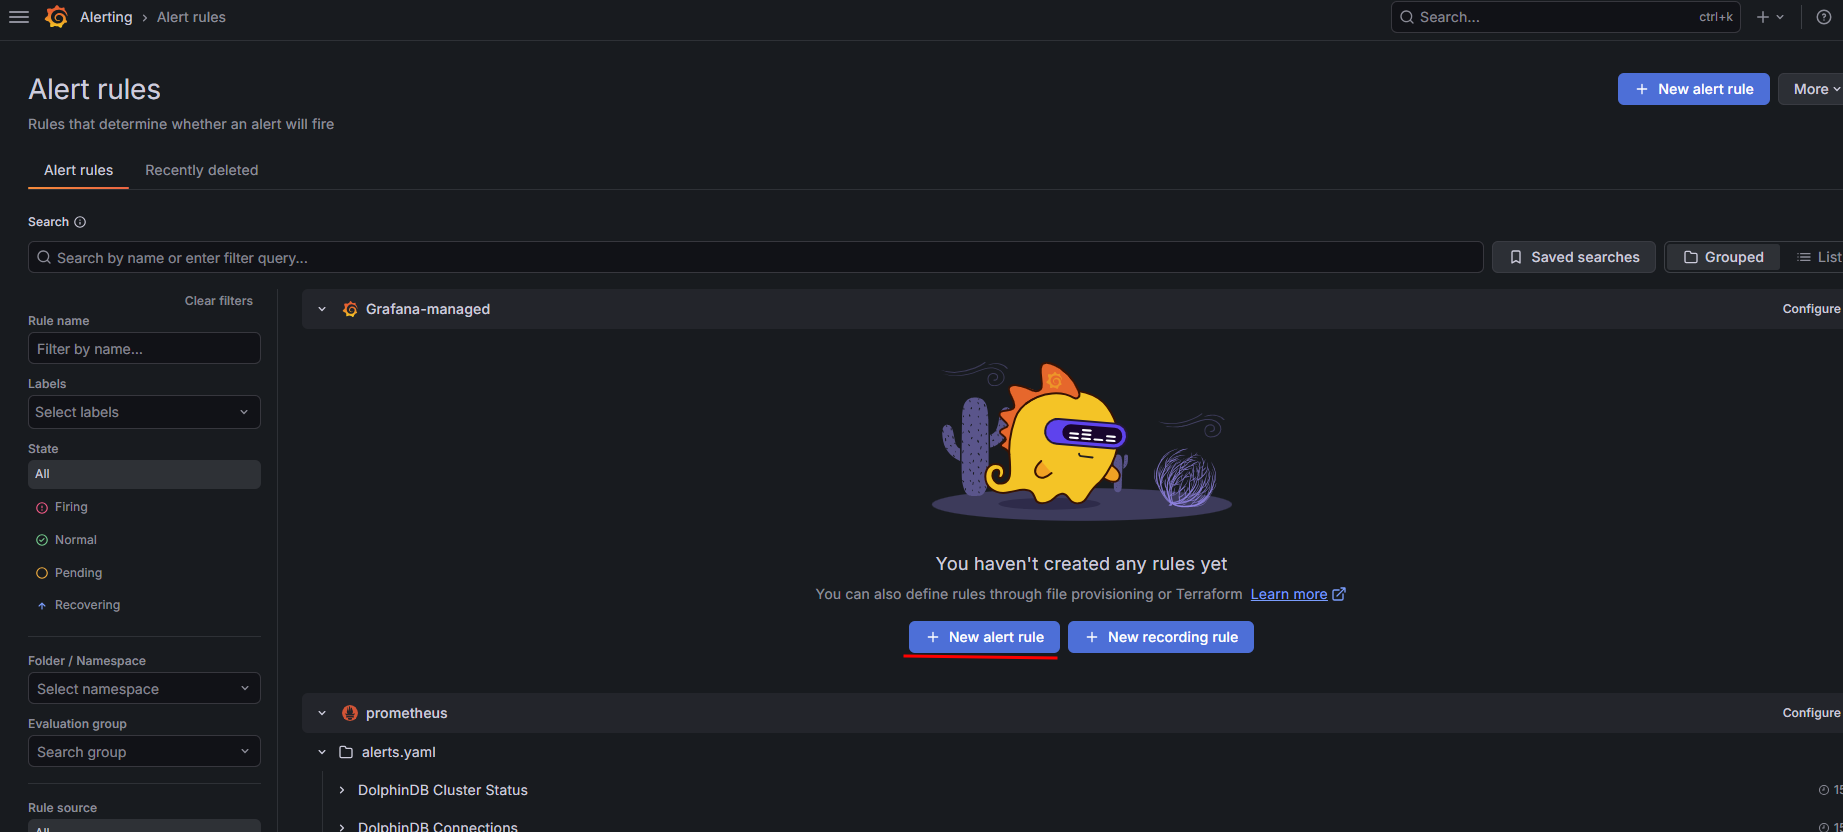
在左侧导航栏单击 Alerting > Alert rules,单击页面右上角的 New alert rule。
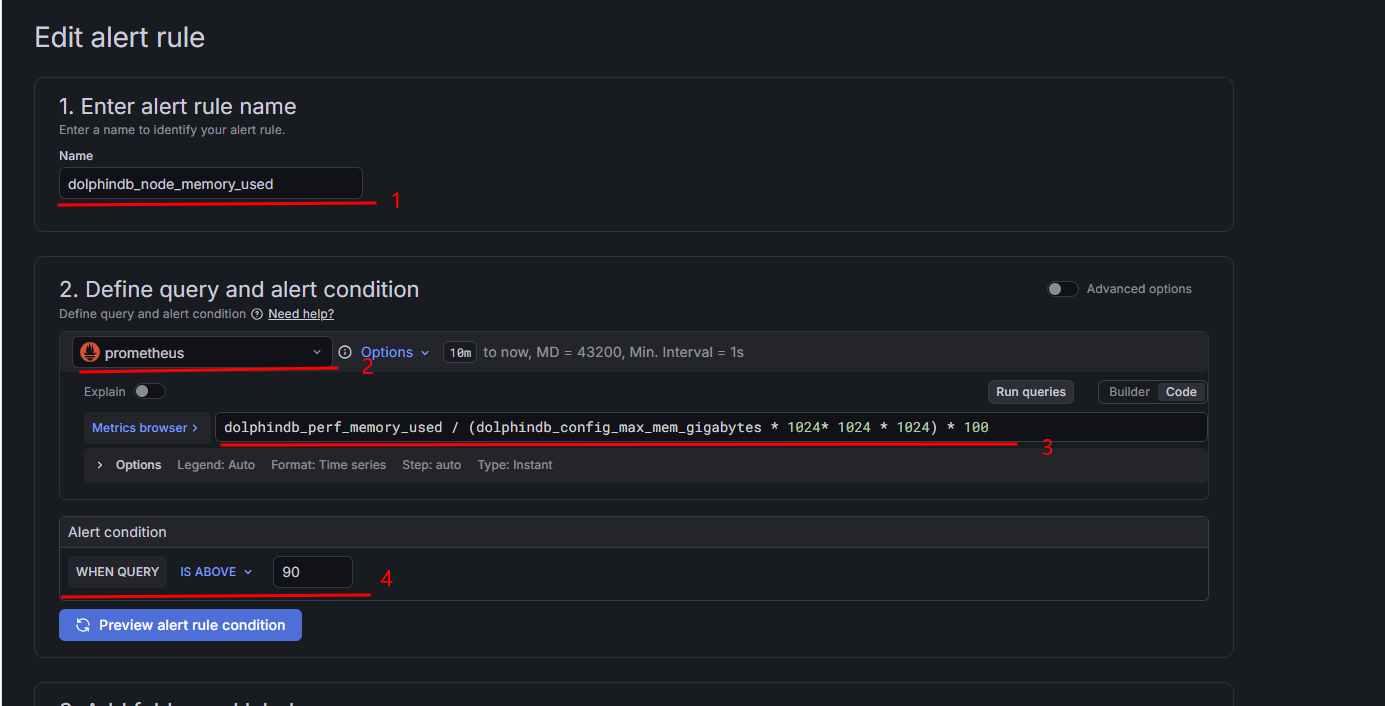
按照以下步骤添加告警规则:
-
在 Name 输入框中填写告警规则的名称。
-
在 Define query and alert condition 区域选择之前创建的 Prometheus 数据源。
-
选择 Builder 或 Code 模式设置需要监控的指标。本例中,在 Code 模式中填写 PromQL 表达式,将指标设置为 DolphinDB 节点已使用内存占最大内存的百分比:
dolphindb_perf_memory_used / (dolphindb_config_max_mem_gigabytes * 1024* 1024 * 1024) * 100 -
在 Alert condition 区域设置告警条件,此处为 IS ABOVE(超过)90,含义为当 DolphinDB 节点已使用内存占最大内存的百分比超过 90 时触发告警。Grafana 还提供了其他条件比如 IS BELOW 、IS EQUAL TO,详情参考官方教程。
-
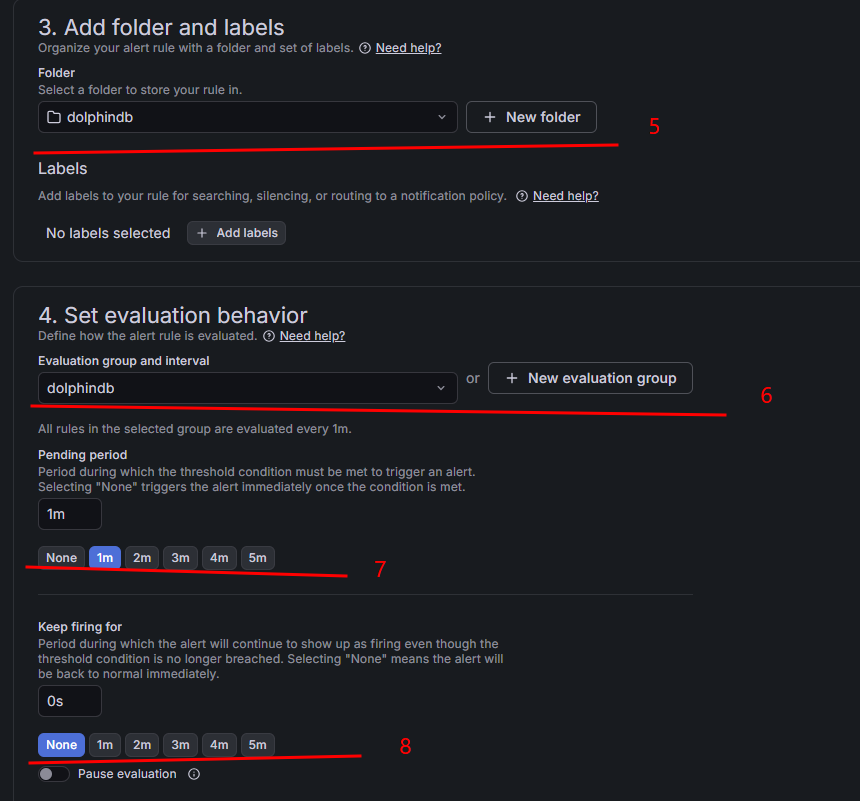
在 Add folder and labels 区域选择存储告警规则的文件夹,如果没有可以单击 New folder 新建文件夹。
-
在 Set evaluation behavior 区域选择告警规则评估组,用于定义规则被评估的频率,如果没有可以单击 New evaluation group 新建评估组。
-
在 Pending period 区域选择阈值条件被满足的情况下持续多久之后触发告警,本例中选择 1 分钟。
-
在 Keep firing for 区域选择在阈值条件不再被满足的情况下,告警的持续时间。本例中选择 None,表示立即停止告警。
-
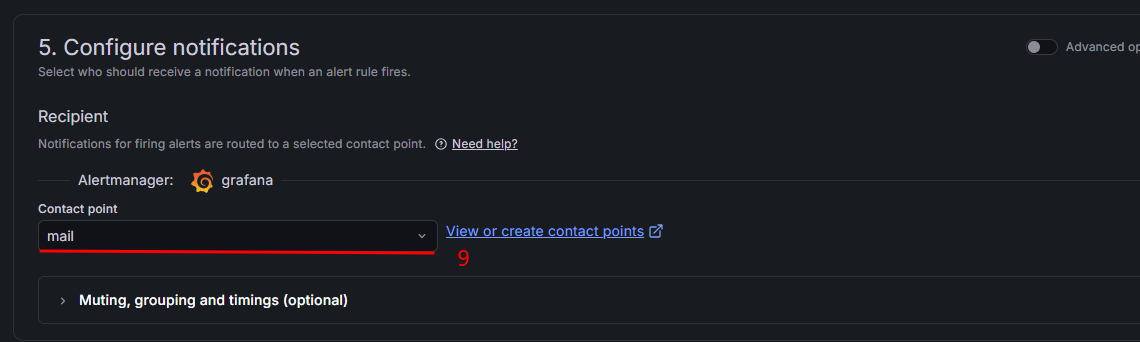
在 Contact point 下拉框中选择告警通知方式,本例中选择之前添加的邮件告警方式。
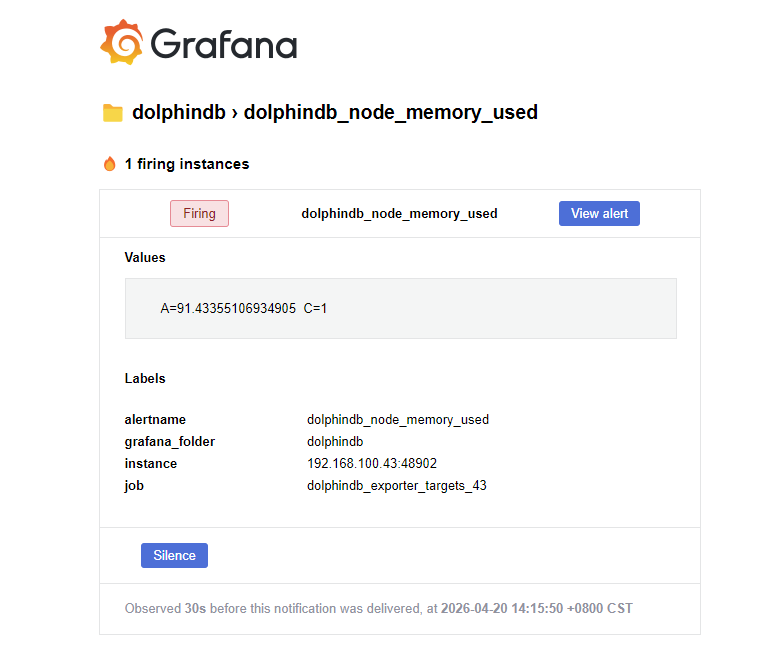
触发告警之后发送邮件:
解除告警之后发送邮件:
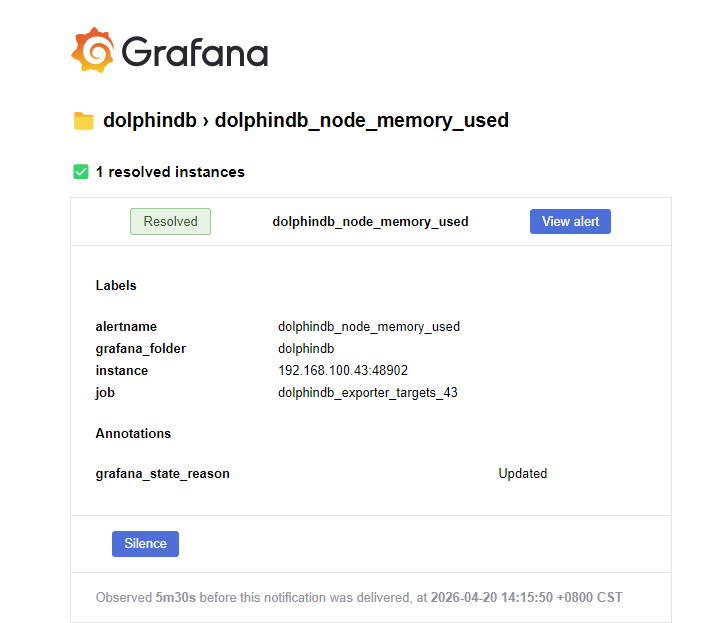
若收到告警消息后需要跳转到具体页面,可以单击 View alert。
3.2 企业微信群机器人告警
添加通知方式
-
添加群机器人并获取 URL。
-
在企业微信群聊中单击右上角的 … 按钮,选择消息推送。
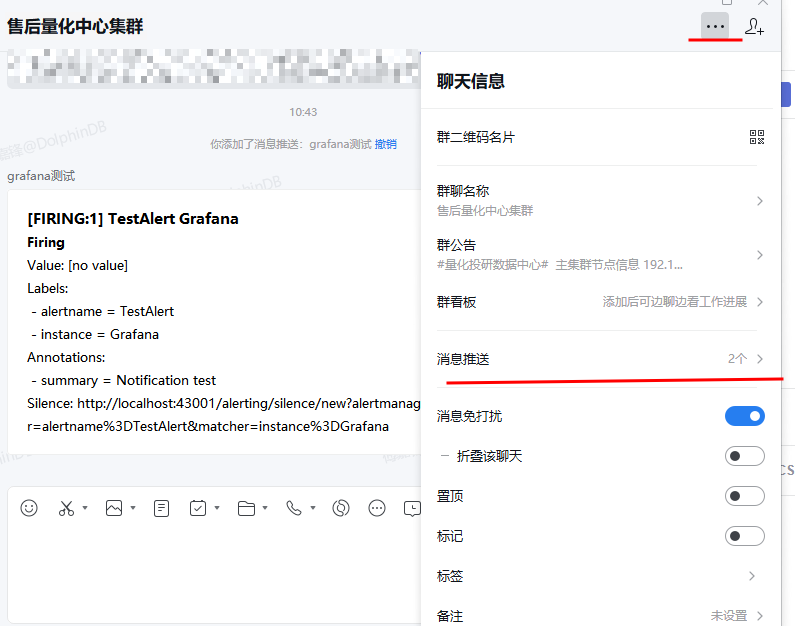
图 26. 图 3-11 获取企业微信机器人 URL 1 -
单击添加,选择自定义消息推送。

图 27. 图 3-13 获取企业微信机器人 URL 2 
图 28. 图 3-14 获取企业微信机器人 URL 3 -
填写机器人名称之后复制下方的 URL。

图 29. 图 3-15 获取企业微信机器人 URL 4
-
-
在 Grafana 中添加企业微信告警方式。
-
在左侧导航栏单击 Alerting > Notification configuration,在 Contact points 页签中单击 New contact point。
图 30. 图 3-16 配置企业微信告警 1 -
选择 WeCom 集成方式并填写相关信息,单击 Save contact point。
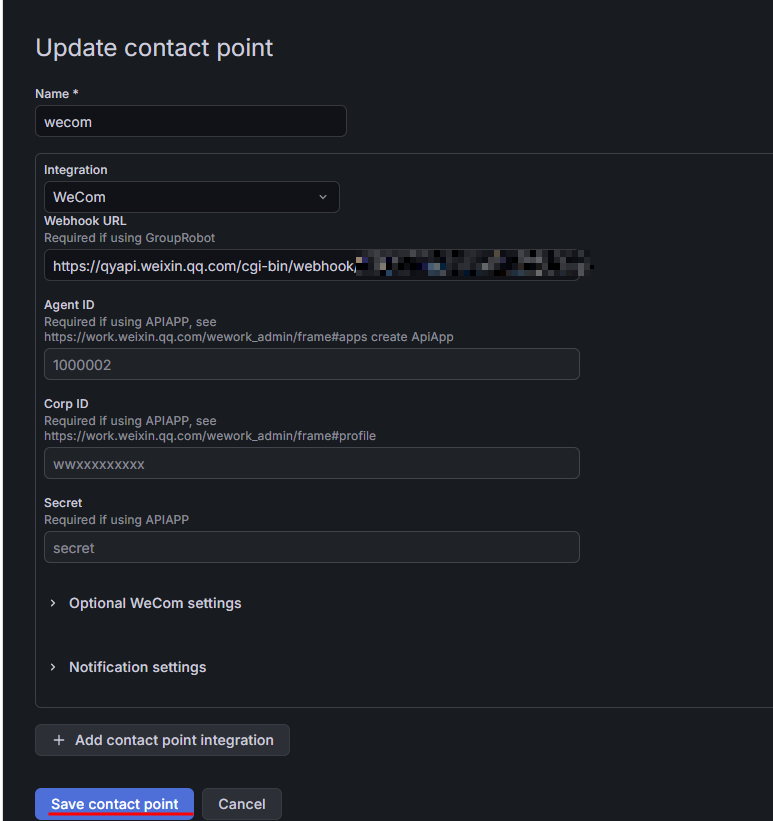
图 31. 图 3-17 配置企业微信告警 2
-
添加告警条件
添加步骤和上方的邮件告警相同,通知方式选择本小节添加的企业微信告警。
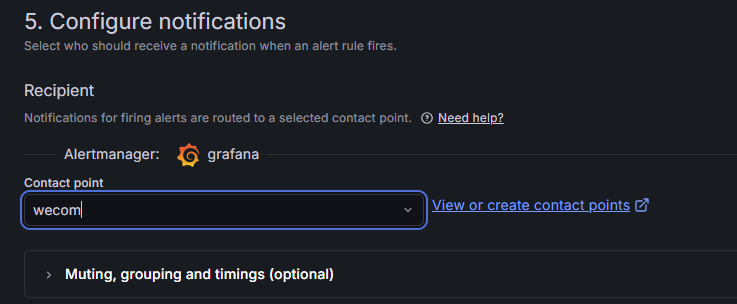
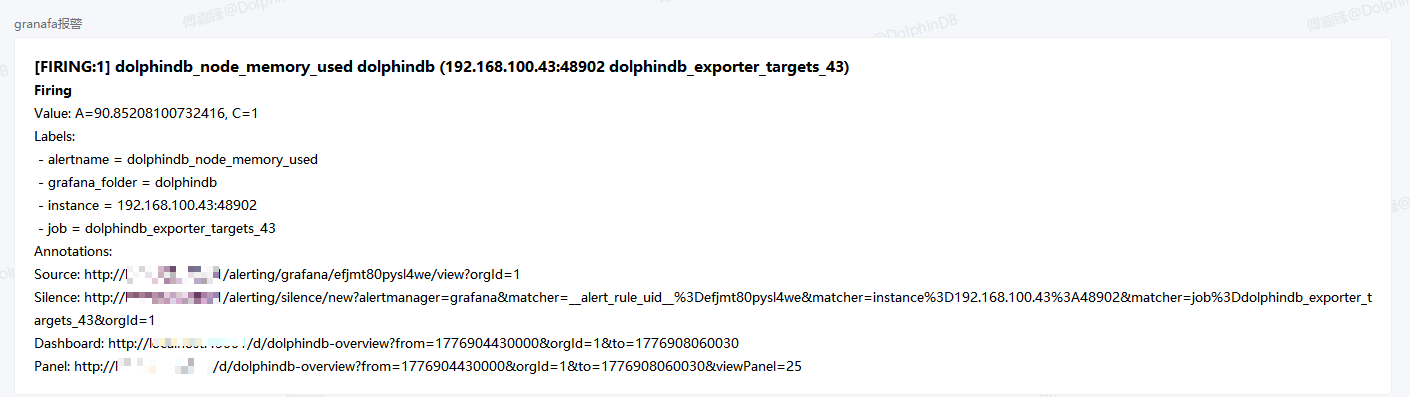
触发告警之后发送通知:
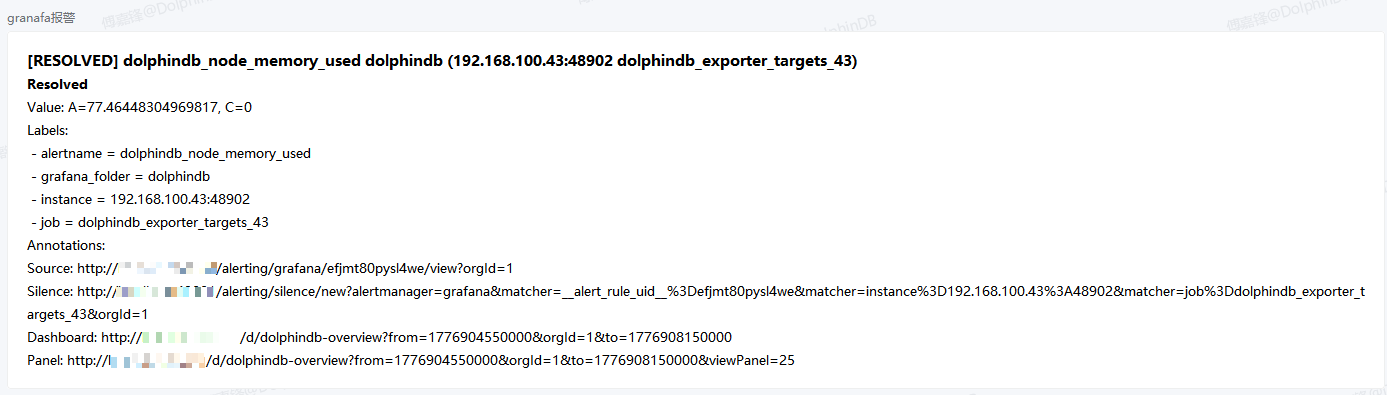
解除告警之后发送通知:
3.3 告警规则参考
下表列举了部分告警规则,配置相关阈值时可以根据环境和业务情况进行调整。
| 告警名称 | PromQL | Grafana 触发条件 |
|---|---|---|
| DolphinDB 掉线告警 |
|
is equal to 0 |
| 节点已用内存超过 90% 告警 |
|
is above 90 |
| 磁盘使用空间超过 90% 告警 |
|
is above 90 |
| 节点连接数超过最大连接数 90% 告警 |
|
is above 90 |
| 当前最大查询时间超过 30 分钟告警 |
|
is above 30 |
4. 自定义指标
DolphinDB Exporter 本身提供了丰富的指标的同时,还支持用户通过编写 dos 文件自定义采集指标。
4.1 配置文件格式
可以通过 YAML 配置文件添加自定义指标,配置文件需要放在 custom_metrics 文件夹中。
name: "指标集名称"
help: "指标集描述"
type: ["指标类型"]  # 如["controller"]
versions: ["版本号"]
enabled: "默认是否启用"
dosfile: "脚本文件路径"  # 可选,与 script 必填其一
script: "直接脚本内容"   # 可选,与 dosfile 必填其一
metrics:
  - name: "指标名称"
    type: "指标类型"     # gauge/counter
    desc: "指标描述"
    labels: ["标签列表"] # 可选
    value_col_name: "指标列名" # 可选
脚本返回值说明
自定义指标脚本需要返回一个字典,其中:
-
键(key)为指标名称。
-
值(value)可以是以下两种类型之一:
-
数值类型:支持 DolphinDB 的 INT、LONG、FLOAT、DOUBLE 类型,将直接作为指标值使用。
-
表格类型:必须包含以下列:
-
指标名称列:数值类型(INT、LONG、FLOAT、DOUBLE),作为指标值,要求列名必须与 YAML 配置文件的对应指标的
value_col_name配置项的值相同;若未配置value_col_name配置项,则要求列名与name配置项的值相同。 -
指标标签列:字符串类型,作为指标的标签值,要求列名必须与 YAML 配置文件的对应指标的
labels配置项的值相同。
-
-
4.2 示例
custom_metrics/dolphindb_get_recent_jobs_metrics.yaml:
name: "get_recent_jobs"
help: "metrics from getRecentJobs()"
type: ["datanode", "computenode", "controller"]
versions: ["1.0.0"]
enabled: true
dosfile: "./dolphindb_get_recent_jobs_metrics.dos"
metrics:
  - name: "total_count"
    type: "gauge"
    desc: "Number of running jobs"
  - name: "count"
    type: "gauge"
    desc: "Number of running jobs per user id and per client ip"
    labels: ["user_id", "client_ip"]
    value_col_name: "count"
  - name: "error_count"
    type: "counter"
    desc: "Number of finished jobs with error per user id and per client ip"
    labels: ["user_id", "client_ip"]
    value_col_name: "count"
custom_metrics/dolphindb_get_recent_jobs_metrics.dos:
t = getRecentJobs()

{
    // 数值类型返回值
    "total_count": (exec count(*) from t where endTime == NULL),
    // 表格类型返回值
    "count": (select count(*) from t where endTime == NULL group by userID as user_id, clientIp as client_ip),
    "error_count": (select count(*) from t where errorMsg != NULL group by userID as user_id, clientIp as client_ip)
}
4.3 使用说明
-
创建 YAML 配置文件并放入 custom_metrics 文件夹。
-
编写脚本,有 2 种配置方式:
-
直接在配置中使用
script字段。 -
通过
dosfile指定脚本文件路径。
-
-
重启 DolphinDB Exporter 加载新配置。
-
在浏览器访问
<导出器所在服务器的地址>:8000/probe?target=<节点IP>:<节点端口号>页面查看添加的指标。
5. 总结
本教程介绍了基于 DolphinDB Exporter + Prometheus + Grafana + dolphindb-datasource-next 的监控方案。DolphinDB Exporter 负责采集服务器及 DolphinDB 资源指标;Prometheus 实现指标定时抓取与时序存储;Grafana 结合 dolphindb-datasource-next 插件完成数据可视化与多渠道告警。该方案适用于 DolphinDB 单节点或高可用集群在高并发读写、查询场景下的资源监控与性能瓶颈定位,助力高效运维、保障系统稳定运行。
6. 附录
下表列举 DolphinDB Exporter 默认支持的指标。
| 指标 | 类别 | 类型 | 含义 | DolphinDB Server 最低版本 | 默认启用 |
|---|---|---|---|---|---|
| dolphindb_up | 无 | Gauge | DolphinDB 是否在线 | 1.00.0 | true |
| dolphindb_perf_cpu_usage | perf | Gauge | DolphinDB 进程占用 CPU 的百分比(单位:无) | 1.00.0 | true |
| dolphindb_perf_memory_used | perf | Gauge | 节点使用的内存(单位:字节) | 1.00.0 | true |
| dolphindb_perf_memory_alloc | perf | Gauge | 节点中 DolphinDB 当前内存池的容量(单位:字节) | 1.00.0 | true |
| dolphindb_perf_disk_capacity | perf | Gauge | 磁盘容量(单位:字节) | 1.00.0 | true |
| dolphindb_perf_disk_free_space | perf | Gauge | 磁盘剩余空间(单位:字节) | 1.00.0 | true |
| dolphindb_perf_last_minute_write_volume | perf | Gauge | 前一分钟写磁盘容量(单位:字节) | 1.00.0 | true |
| dolphindb_perf_last_minute_read_volume | perf | Gauge | 前一分钟读磁盘容量(单位:字节) | 1.00.0 | true |
| dolphindb_perf_last_minute_network_recv | perf | Gauge | 前一分钟网络接收字节数(单位:字节) | 1.00.0 | true |
| dolphindb_perf_last_minute_network_send | perf | Gauge | 前一分钟网络发送字节数(单位:字节) | 1.00.0 | true |
| dolphindb_perf_disk_read_rate | perf | Gauge | 磁盘读速率(单位:字节/秒) | 1.00.0 | true |
| dolphindb_perf_disk_write_rate | perf | Gauge | 磁盘写速率(单位:字节/秒) | 1.00.0 | true |
| dolphindb_perf_network_send_rate | perf | Gauge | 网络发送速率(单位:字节/秒) | 1.00.0 | true |
| dolphindb_perf_network_recv_rate | perf | Gauge | 网络接收速率(单位:字节/秒) | 1.00.0 | true |
| dolphindb_perf_cum_msg_latency | perf | Gauge | 流数据订阅节点所有已接收的消息的平均延时(单位:纳秒) | 1.00.0 | true |
| dolphindb_perf_last_msg_latency | perf | Gauge | 流数据订阅节点最后收到的消息的延时(单位:纳秒) | 1.00.0 | true |
| dolphindb_perf_max_last10_query_time | perf | Gauge | 前 10 个完成的查询执行所耗费时间的最大值(单位:纳秒) | 1.00.0 | true |
| dolphindb_perf_med_last10_query_time | perf | Gauge | 前 10 个完成的查询执行所耗费时间的中间值(单位:纳秒) | 1.00.0 | true |
| dolphindb_perf_med_last100_query_time | perf | Gauge | 前 100 个完成的查询执行所耗费时间的中间值(单位:纳秒) | 1.00.0 | true |
| dolphindb_perf_max_last100_query_time | perf | Gauge | 前 100 个完成的查询执行所耗费时间的最大值(单位:纳秒) | 1.00.0 | true |
| dolphindb_perf_max_running_query_time | perf | Gauge | 当前正在执行的查询的耗费时间的最大值(单位:纳秒) | 1.00.0 | true |
| dolphindb_perf_avg_load | perf | Gauge | 平均负载(单位:无) | 1.00.0 | true |
| dolphindb_perf_job_load | perf | Gauge | 作业负载(单位:无) | 1.00.0 | true |
| dolphindb_perf_running_jobs | perf | Gauge | 正在执行中的作业和任务数(单位:无) | 1.00.0 | true |
| dolphindb_perf_queued_jobs | perf | Gauge | 队列中的作业和任务数(单位:无) | 1.00.0 | true |
| dolphindb_perf_connection_num | perf | Gauge | 节点连接数 | 1.00.0 | true |
| dolphindb_cluster_chunk_status_incomplete | cluster_chunk_status | Gauge | DolphinDB 集群中状态为未完成的 chunk 的数量(单位:无) | 1.00.0 | false |
| dolphindb_cluster_chunk_status_count | cluster_chunk_status | Gauge | 每个数据库的 chunk 数量(单位:无) | 1.00.0 | false |
| dolphindb_get_running_queries_total_count | get_running_queries | Gauge | 当前正在执行的查询任务总数 | 1.00.0 | true |
| dolphindb_get_running_queries_count | get_running_queries | Gauge | 当前每个 IP、每个用户的正在执行的查询任务数 | 1.00.0 | true |
| dolphindb_get_recovery_task_status_total_count | get_recovery_task_status | Gauge | 恢复任务总数 | 1.00.0 | true |
| dolphindb_get_recovery_task_status_waiting_count | get_recovery_task_status | Gauge | 等待中的恢复任务数量 | 1.00.0 | true |
| dolphindb_get_recovery_task_status_in_progress_count | get_recovery_task_status | Gauge | 进行中的恢复任务数量 | 1.00.0 | true |
| dolphindb_get_recovery_task_status_finished_count | get_recovery_task_status | Gauge | 已完成的恢复任务数量 | 1.00.0 | true |
| dolphindb_get_recovery_task_status_aborted_count | get_recovery_task_status | Gauge | 已中止的恢复任务数量 | 1.00.0 | true |
| dolphindb_get_session_memory_stat_dimensional_table_bytes | get_session_memory_stat | Gauge | 维度表占用的内存(单位:字节) | 1.00.0 | true |
| dolphindb_get_session_memory_stat_shared_table_bytes | get_session_memory_stat | Gauge | 共享表占用的内存(单位:字节) | 1.00.0 | true |
| dolphindb_get_session_memory_stat_olap_tablet_bytes | get_session_memory_stat | Gauge | OLAP 表占用的内存(单位:字节) | 1.00.0 | true |
| dolphindb_get_session_memory_stat_olap_cache_engine_bytes | get_session_memory_stat | Gauge | OLAP 缓存引擎使用的内存(单位:字节) | 1.00.0 | true |
| dolphindb_get_session_memory_stat_olap_cached_symbol_base_bytes | get_session_memory_stat | Gauge | OLAP 缓存符号基础占用的内存(单位:字节) | 1.00.0 | true |
| dolphindb_get_session_memory_stat_dfs_metadata_bytes | get_session_memory_stat | Gauge | DFS 元数据存储使用的内存(单位:字节) | 1.00.0 | true |
| dolphindb_get_session_memory_stat_tsdb_cache_engine_bytes | get_session_memory_stat | Gauge | TSDB 缓存引擎使用的内存(单位:字节) | 2.00.0 | true |
| dolphindb_get_session_memory_stat_tsdb_level_file_index_bytes | get_session_memory_stat | Gauge | TSDB Level 文件索引占用的内存(单位:字节) | 2.00.0 | true |
| dolphindb_get_session_memory_stat_tsdb_cached_symbol_base_bytes | get_session_memory_stat | Gauge | TSDB 缓存符号基础占用的内存(单位:字节) | 2.00.0 | true |
| dolphindb_get_session_memory_stat_iot_latest_key_cache_bytes | get_session_memory_stat | Gauge | IoT 最新键缓存使用的内存(单位:字节) | 3.00.0 | true |
| dolphindb_get_session_memory_stat_iot_static_table_cache_bytes | get_session_memory_stat | Gauge | IoT 静态表缓存占用的内存(单位:字节) | 3.00.0 | true |
| dolphindb_get_session_memory_stat_streaming_pub_queue | get_session_memory_stat | Gauge | 流数据发布队列深度 | 1.00.0 | true |
| dolphindb_get_session_memory_stat_streaming_sub_queue | get_session_memory_stat | Gauge | 流数据订阅队列深度 | 1.00.0 | true |
| dolphindb_get_session_memory_stat_olap_cache_engine_capacity_bytes | get_session_memory_stat | Gauge | OLAP 缓存引擎的总容量(单位:字节) | 1.00.0 | true |
| dolphindb_get_session_memory_stat_tsdb_cache_engine_capacity_bytes | get_session_memory_stat | Gauge | TSDB 缓存引擎的总容量(单位:字节) | 2.00.0 | true |
| dolphindb_get_session_memory_stat_user_mem_bytes | get_session_memory_stat | Gauge | 每个 IP 下用户使用的总内存(单位:字节) | 1.00.0 | true |
| dolphindb_get_console_jobs_total_count | get_console_jobs | Gauge | 当前正在执行的终端任务总数 | 1.00.0 | true |
| dolphindb_get_console_jobs_count | get_console_jobs | Gauge | 当前每个 IP、每个用户的正在执行的终端任务数 | 1.00.0 | true |
| dolphindb_get_recent_jobs_total_count | get_recent_jobs | Gauge | 当前正在执行的批处理任务总数 | 1.00.0 | true |
| dolphindb_get_recent_jobs_count | get_recent_jobs | Gauge | 当前每个 IP、每个用户的正在执行的批处理任务数 | 1.00.0 | true |
| dolphindb_get_recent_jobs_error_count | get_recent_jobs | Gauge | 每个 IP、每个用户的累计的出错的批处理任务数 | 1.00.0 | true |
| dolphindb_get_transaction_status_total_count | get_transaction_status | Gauge | 当前正在执行的事务总数 | 1.00.0 | true |
| dolphindb_get_transaction_status_count | get_transaction_status | Gauge | 当前正在执行的事务数,按事务类型分组 | 1.00.0 | true |
| dolphindb_get_streaming_stat_sub_workers_total_count | get_streaming_stat | Gauge | 订阅工作线程总数 | 1.00.0 | true |
| dolphindb_get_streaming_stat_sub_workers_error_count | get_streaming_stat | Gauge | 前一分钟有错误的订阅工作线程数 | 1.00.0 | true |
| dolphindb_get_streaming_stat_sub_workers_queue_depth | get_streaming_stat | Gauge | 每个工作线程 ID 的队列深度 | 1.00.0 | true |
| dolphindb_get_streaming_stat_sub_conns_total_count | get_streaming_stat | Gauge | 订阅连接总数 | 1.00.0 | true |
| dolphindb_get_streaming_stat_sub_conns_last_msg_latency | get_streaming_stat | Gauge | 每个发布队列的最后消息延迟(单位:纳秒) | 1.00.0 | true |
| dolphindb_get_streaming_stat_pub_conns_queue_depth | get_streaming_stat | Gauge | 每个工作线程 ID 的发布队列深度 | 1.00.0 | true |
| dolphindb_get_streaming_stat_pub_tables_total_count | get_streaming_stat | Gauge | 发布流表总数 | 1.00.0 | true |
| dolphindb_get_streaming_stat_pub_tables_count | get_streaming_stat | Gauge | 每个订阅者 IP 的发布表数量 | 1.00.0 | true |
| dolphindb_get_streaming_stat_udp_pub_tables_total_count | get_streaming_stat | Gauge | UDP 发布表总数 | 1.00.0 | true |
| dolphindb_get_stream_engine_stat_count | get_stream_engine_stat | Gauge | 流引擎数量统计(按类型分组) | 1.00.0 | true |
| dolphindb_get_stream_engine_stat_error_count | get_stream_engine_stat | Gauge | 流引擎错误数量统计(按类型分组) | 1.00.0 | true |
| dolphindb_get_stream_engine_stat_mem_bytes | get_stream_engine_stat | Gauge | 流引擎内存使用量(按类型分组,单位:字节) | 1.00.0 | true |
| dolphindb_get_replication_status_is_master | get_replication_stat | Gauge | 集群是否为异步复制主集群 | 2.00.9 | true |
| dolphindb_get_replication_status_total_tasks | get_replication_stat | Gauge | 前一分钟异步复制任务数 | 2.00.9 | true |
| dolphindb_get_replication_status_truncated_tasks | get_replication_stat | Gauge | 前一分钟主集群回收任务数 | 2.00.9 | true |
| dolphindb_get_replication_status_completed_tasks | get_replication_stat | Gauge | 前一分钟从集群完成任务数 | 2.00.9 | true |
| dolphindb_get_replication_status_failed_tasks | get_replication_stat | Gauge | 前一分钟从集群失败任务数 | 2.00.9 | true |
| dolphindb_get_replication_status_waiting_tasks | get_replication_stat | Gauge | 前一分钟从集群等待任务数 | 2.00.9 | true |
| dolphindb_get_replication_status_executing_tasks | get_replication_stat | Gauge | 前一分钟从集群执行中任务数 | 2.00.9 | true |
| dolphindb_config_max_mem_gigabytes | config | Gauge | 节点的最大内存(单位 GB) | 1.00.0 | true |
| dolphindb_config_max_cores | config | Gauge | 节点的最大核数 | 1.00.0 | true |
| dolphindb_config_max_connections | config | Gauge | 节点的最大连接数 | 1.00.0 | true |
| dolphindb_config_max_sub_queue_depth | config | Gauge | 节点订阅端队列深度上限 | 1.00.0 | true |
| dolphindb_config_max_pub_queue_depth | config | Gauge | 节点发布端队列深度上限 | 1.00.0 | true |
| dolphindb_config_license_expiration | config | Gauge | License 到期时间 | 1.00.0 | true |
| dolphindb_get_cluster_volume_usage_bytes | get_cluster_volume | Gauge | 节点的各个 volume 的使用量 | 3.00.4 | true |
| dolphindb_get_cluster_volume_capacity_bytes | get_cluster_volume | Gauge | 节点的各个 volume 的总容量 | 3.00.4 | true |
| machine_up | 无 | Gauge | 导出器所在机器是否在线 | N/A | true |
| machine_system_perf_cpu_counts | system_perf | Gauge | 导出器所在机器的 CPU 逻辑核数 | N/A | true |
| machine_system_perf_cpu_percent | system_perf | Gauge | 导出器所在机器的 CPU 使用率 | N/A | true |
| machine_system_perf_disk_io_read_bytes | system_perf | Gauge | 导出器所在机器的硬盘读字节总数 | N/A | true |
| machine_system_perf_disk_io_write_bytes | system_perf | Gauge | 导出器所在机器的硬盘写字节总数 | N/A | true |
| machine_system_perf_disk_total_bytes | system_perf | Gauge | 导出器所在机器的硬盘总容量 | N/A | true |
| machine_system_perf_disk_usage_bytes | system_perf | Gauge | 导出器所在机器的硬盘使用量 | N/A | true |
| machine_system_perf_disk_usage_percent | system_perf | Gauge | 导出器所在机器的硬盘使用率 | N/A | true |
| machine_system_perf_network_io_read_bytes | system_perf | Gauge | 导出器所在机器的网络读字节总数 | N/A | true |
| machine_system_perf_network_io_write_bytes | system_perf | Gauge | 导出器所在机器的网络写字节总数 | N/A | true |
| machine_system_perf_virtual_memory_available_bytes | system_perf | Gauge | 导出器所在机器的虚拟内存可用量 | N/A | true |
| machine_system_perf_virtual_memory_total_bytes | system_perf | Gauge | 导出器所在机器的虚拟内存总量 | N/A | true |
| machine_system_perf_virtual_memory_used_bytes | system_perf | Gauge | 导出器所在机器的虚拟内存已用量 | N/A | true |
| dolphindb_running_log_error_count | running_log | Gauge | 节点的最新 100 条日志中的 ERROR 日志数量 | 1.00.0 | true |
| dolphindb_running_log_warning_count | running_log | Gauge | 节点的最新 100 条日志中的 WARNING 日志数量 | 1.00.0 | true |