Slow Queries or Writes
The reasons for slow queries or writes can be varied. This page analyzes several main causes, including configuration, query/write performance, database and table design, as well as system load.
Configuration
Ensure the following configuration parameters are properly set to avoid slow queries or writes:
| Parameter | Description | Recommendation |
|---|---|---|
| diskIOConcurrencyLevel | The number of threads for reading and writing to disk. The default value is 1. |
For SSDs, set it to 0; For HDDs, set it to the number of volumes configured on the node. |
| workerNum | The size of worker pool for regular interactive jobs. | Set it to the number of licensed CPU cores. Ensure the controller’s workerNum is large enough to avoid query restrictions. |
| TSDBAsyncSortingWorkerNum | The number of threads for asynchronous sorting in the TSDB cache engine. The default value is 1. | For intensive and large-scale writes, increase this parameter for higher write performance, but it may impact query performance as queries have to wait for asynchronous sorting to finish. |
| redoLogDir/TSDBRedoLogDir | The directory of the redo log of OLAP/TSDB engine. | Set it to SDDs for higher write performance. |
Query/Write Performance
Write Performance
In DolphinDB, writing a batch of records (e.g., 5000 records, excluding
excessively large data) takes about the same time as writing a single record,
with network-related issues being the primary consumer. It is recommeded to use
the MultithreadedTableWriter interface of DolphinDB APIs to
write data in batches on the client side.
Query Performance
Use the getQueryStatus function to get the status of a running
query initialized on the current node. It returns a table with the following
columns:
- id: The total count of the query tasks that have been executed.
- sessionId: ID of the session where the query is initialized. Please note
that sessionId of the jobs submitted with
submitJobcannot be obtained. - userId: The user who initialized the task.
- query: The query statement.
- startTime: The timestamp when the query starts.
- elapsedTimeInMs: The elapsed time (in ms) of the query.
- memoryUsage: The memory used by the variables and results of the query (in bytes).
- totalTaskCount: Total count of tasks based on the partitions involved in the query.
- completedTaskCount: Count of completed tasks.
- percentComplete: The completion percentage of the query.
Based on “totalTaskCount” and the query statement, you can identify if the query is slowed by excessive partitions or concurrent queries.
If a query involves many partitions, you can:
- Adjust the maxPartitionNumPerOuery configuration parameter;
- Use the
WHEREclause to reduce partition sizesfor better performance; - Add "[HINT_EXPLAIN]" after SQL keywords
SELECT/EXECto monitor the real-time performance and execution order of a SQL query. For example:select [HINT_EXPLAIN] * from tb where id > 20
- A SQL query with "[HINT_EXPLAIN]" returns a JSON string indicating the execution plan instead of the actual query result.
- Currently, "[HINT_EXPLAIN]" does not work with
UPDATEandDELETEstatements.
Database and Table Design
Check if settings related to involved databases and tables are appropriate, such as:
- partition size
- sort key of the TSDB engine
- primary key of the PKEY engine
System Load
Hardware performance bottlenecks can also lead to slow queries or writes. To analyze system performance, check system load to identify if the following issues exist:
- CPU-intensive processes
- IO-bound processes
- A large number of processes
Check System Load
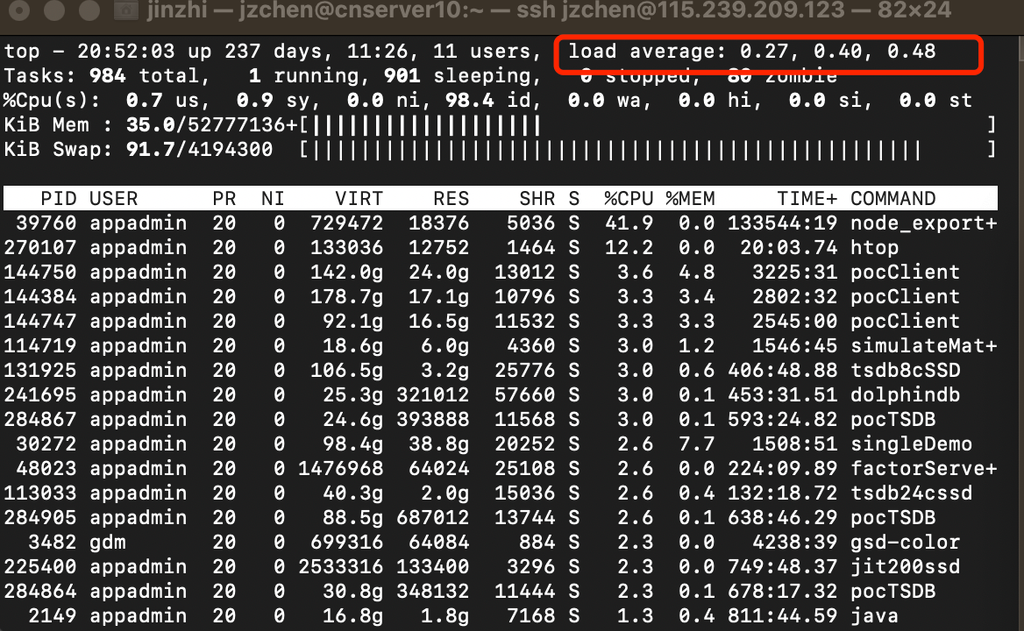
The top and uptime shell commands can be used
to check system load. They both return the system’s load average over 1, 5, and
15 minutes, corresponding to 0.27, 0.40, and 0.48 in the red box below:

In simple terms, load average is the average number of processes in a runnable or uninterruptible state (i.e., active processes). Note that it is not directly related to CPU usage.
- Runnable processes are those either using the CPU or waiting for CPU, shown
as R state (Running or Runnable) in
pscommand. - Uninterruptible processes are those in a critical kernel process and cannot
be interrupted. The most common example is processes waiting for I/O
responses from hardware devices, shown as D state (Uninterruptible Sleep or
Disk Sleep) in
pscommand.
- The uninterruptible state is actually a protection mechanism for processes and hardware devices by the system. For example, when a process is reading or writing data to a disk, it cannot be interrupted until the disk responds to ensure data consistency.
- Uninterruptible processes appear as if the system is "frozen".
Access System Load
grep 'model name' /proc/cpuinfo | wc -llscpu |grep 'CPU(s)'If the load average exceeds 70% of the number of CPUs, it is recommended to check if high load is to blame for slow process responses.
CPU usage reflects how busy the CPU is during a unit of time, which doesn’t necessarily correspond to load average. For example:
- CPU-intensive processes that use a lot of CPU can increase the load average, in which case the two metrics are aligned.
- I/O-bound processes that are waiting for I/O can also increase the load average, but the CPU usage may not be very high.
- A large number of processes waiting for CPU scheduling can also increase the load average, in which case the CPU usage is also relatively high.
To identify the root causes of the increased load average, the
mpstat command can be used to get the changes in CPU usage.
The following examples demonstrate the output and corresponding causes in the
above-mentioned scenarios, helping users diagnose their problems.
CPU-intensive processes

- Output: One CPU is at 100% usage, but its iowait is 0.
- Cause: The CPU being at 100% usage.
I/O-bound processes

- Output: The load average gradually increases to 1.06 over one minute. One CPU’s system CPU usage rises to 23.87%, and the iowait reaches 67.53%.
- Cause: The rise in iowait.
Then, use pidstat to identify which process is causing such a
high iowait:

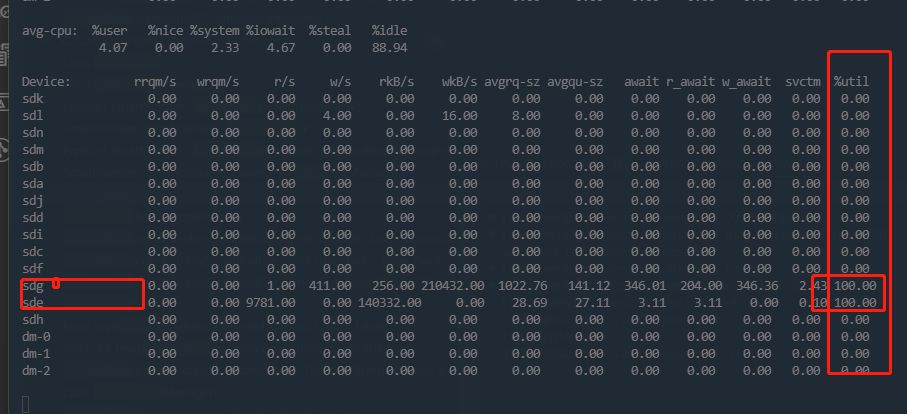
iostat to check disk
information:iostat -x 1Output:

If the last column (utilization ratio) is close to or reaches 100%, it indicates
a potential disk bottleneck. Besides, cross-reference iostat
with df -h and DolphinDB’s configuration files to confirm if
the displayed disk is used by DolphinDB.
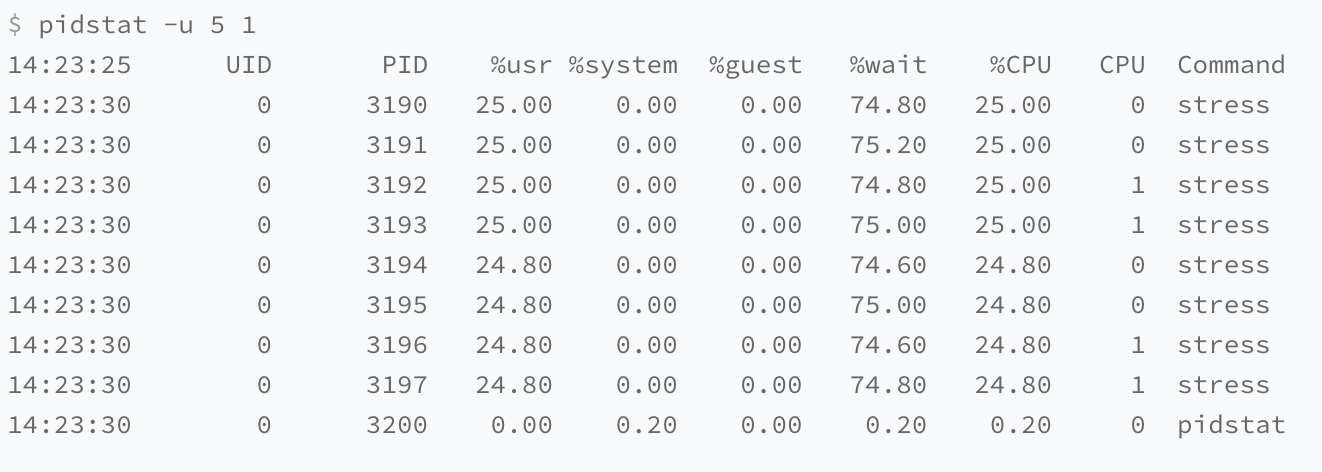
A large number of processes

- Output: 8 processes are contending for 2 CPUs, with each process waiting for the CPU for up to 75% of the time (indicated by the %wait column).
- Cause: These processes exceed the CPU’s computational capacity, leading to CPU overload.
