DolphinDB Log Analysis Tool
Log investigations often involve inefficient, repetitive tasks. Users must manually locate log files, identify relevant time ranges, and cross-reference logs across multiple nodes. This process is time-consuming, error-prone, and may result in missing critical information, delaying issue resolution.
To address these challenges, DolphinDB has developed a module —
DDBLogAnalyser. It supports batch processing of logs, precise time
range filtering, customizable reports, and real-time log monitoring. Users can configure
whitelists and blacklists to filter logs, focus on key information, and enable email
alerts with customizable content. Additionally, the tool allows for customized log
parsing, offering a comprehensive and efficient solution for log analysis. This tutorial
provides a detailed introduction to the tool's configuration, interfaces, and use
cases.
1. Configuration Requirements
DolphinDB Linux version 2.00.10 or higher. Tested versions include 2.00.10, 2.00.11, 2.00.12, 2.00.13, 2.00.14, 3.00.0, and 3.00.1.
On data or compute node:
- Configure persistenceDir to set the persistence directory for shared stream tables.
- Install the httpClient plugin for sending HTTP requests or emails. Required version: 3.00.1.5, 2.00.13.5, 3.00.0.9, 2.00.12.12, 2.00.11.13, 2.00.10.16, or higher.
2. Quick Start
Place the appendix DDBLogAnalyser file in the server/modules directory, and execute the following scripts on data or compute node.
2.1 Batch Analyzing Logs
The following demo implements batch reading of logs from the directory /dolphindb/server/log and loads them into the table originLogLines. The log time range is from 1 hour ago to the current timestamp. Subscribe to and parse the logs, and the results are output into the table logAnalysisResult:
clearCachedModules()
go
use DDBLogAnalyser::config
use DDBLogAnalyser::logReader
use DDBLogAnalyser::logParser::logParser
use DDBLogAnalyser::reportGenerator::reportGenerator
go

clearEnv()
go
batchModeVersion = version() // Same DolphinDB version as the logs in logDir
config = getExampleConfig(batchModeVersion)
config["logDir"] = "/dolphindb/server/log"
config["startTime"] = temporalAdd(now(), -1H) // Log starttime (current timestamp - 1H)
config["endTime"] = now() // Log endtime (current timestamp)
initConfig(config)
go

readLog()
parseLog()
generateReport()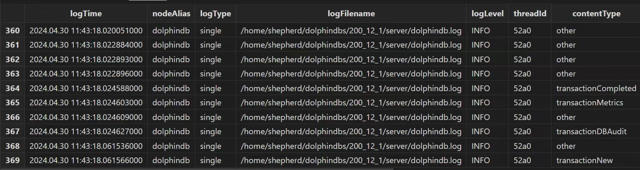
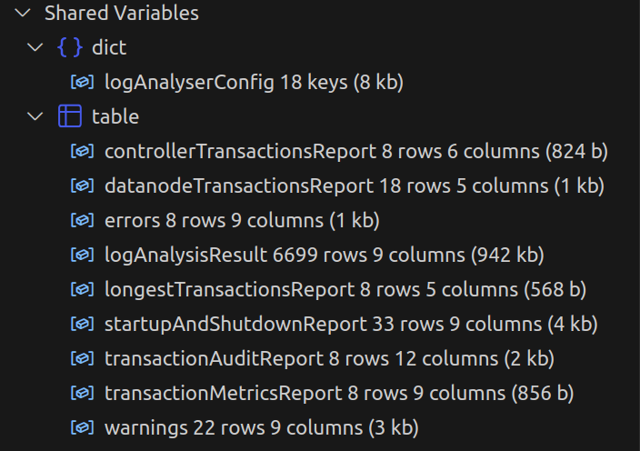
After parsing, multiple report tables are generated, including errors, warnings, longestTransactionsReport, transactionAuditReport, etc.
2.2 Real-Time Monitoring Logs
To monitor the specified cluster logs in real-time, all nodes in the cluster should be online to run the script. After running the script, only the controller and agent need to remain online for monitoring logs of all nodes.
This demo implements streaming reading of logs from all nodes of a specified remote cluster into the table originLogLines. Subscribe to and parse the logs, and the results are output into the table logAnalysisResult:
try { loadPlugin("httpClient") } catch(err) { print(err) }
go
clearCachedModules()
go
use DDBLogAnalyser::config
use DDBLogAnalyser::logReader
use DDBLogAnalyser::logParser::logParser
use DDBLogAnalyser::reportGenerator::reportGenerator
use DDBLogAnalyser::alertGenerator
go

clearEnv()
go
config = getExampleConfig()
config["remoteControllerSites"] = [
  "192.168.100.43:7600",
  "192.168.100.44:7600",
  "192.168.100.45:7600"
] // IP:ports of all control nodes in the remote cluster
config["remoteUsername"] = "admin" // Administrator account of the remote cluster
config["remotePassword"] = "123456" // Administrator password of the remote cluster
alertConfig = dict(STRING, ANY)
alertConfig["userId"] = "xxx@xxx.com" // Alert sending email account, must enable SMTP
alertConfig["pwd"] = "xxxxxx" // Alert sending email password
alertConfig["recipient"] = "xxx@xxx.com" // Alert to recipient email
alertConfig["logLevelFilter"] = ["DEBUG"] // Filtering by log level to exclude DEBUG logs
alertConfig["whitelist"] = ["%whitelist error%"] // Use like to filter logs by content, with priority given to matching. No need to configure if whitelist is not required.
alertConfig["blacklist"] = ["%blacklist error%"] // Use like to filter unwanted logs by content, effective after the whitelist. No need to configure if blacklist is not required.
config["alertConfig"] = alertConfig
initConfig(config)
go

readLog()
parseLog()
initAlertGenerator()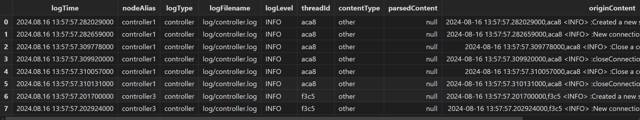
Send email alerts for logs containing “whitelist error”.
Note: Modify the email configuration in the config dictionary, and ensure the email service supports SMTP).
writeLog("whitelist error")3. Configuration References
General configuration parameters:
| Configuration Parameter | Type | Description |
|---|---|---|
| mode | INTEGRAL |
|
| resultType | STRING |
|
| resultDbName | STRING | The database name used for storing the result table, used when resultType is dfs. |
| resultTbName | STRING | The result table name. |
| originLogLinesTbName | STRING | The name of the stream table that reads the raw logs. |
| logParserProjects | STRING vector |
The log parsing projects, whose value must correspond to filenames under logParser/projects. For details, refer to 5.1 Customized Parsing. If empty, all parsing projects are called. |
| reportGeneratorProjects | STRING vector |
The report generation projects, whose value must correspond to filenames under reportGenerator/projects. For details, refer to 5.2 Customized Reports. If empty, all report items are called. |
For batch processing:
|
Configuration Parameter |
Type |
Description |
|---|---|---|
| version | STRING |
The DolphinDB version corresponding to the log. Must be specified to at least the third-level version (e.g. 2.00.12). Note: To analyze logs before and after upgrading DolphinDB to the third-level version (e.g., from 2.00.11.x to 2.00.12.x), use startTime and endTime to submit readLog tasks separately for each version. Mismatched versions may cause log parsing failures. |
| startTime | TEMPORAL | Reads from the start time (or a short period before). |
| endTime | TEMPORAL | Reads until the end time (or a short period after). |
| logDir | STRING |
Directory folder. Only contains DolphinDB log files, and must use the original log filenames. Log Type Recognition Rules:
|
| logTypes | DICTIONARY |
Customizes the node types corresponding to the logs. For example: {"node2": "Computenode"}. Recognizes logs with the filename {timestamp}node2.log as compute node. |
For stream processing:
|
Configuration Parameter |
Type |
Description |
|---|---|---|
| remoteControllerSites | STRING vector |
The IP:port of all controllers in the remote cluster. For standalone mode, it is a vector with only one IP: port element. Not required for monitoring the local cluster (where the log analysis tool is located). |
| remoteUsername | STRING | The administrator account for the remote cluster, which must have administrator privileges. Not required for monitoring the local cluster. |
| remotePassword | STRING | The administrator account password for the remote cluster. Not required for monitoring the local cluster. |
| getLogDuration | Non-negative scalar | The polling interval for fetching DolphinDB logs, with a default value of 3000 ms. |
| alertConfig | STRING-ANY DICTIONARY | For details, refer to the alertConfig below. |
alertConfig:
|
Configuration Parameter |
Type |
Description |
|---|---|---|
| userId | STRING | The email account for sending alerts. Note: SMTP protocol must be enabled. |
| pwd | STRING | The password for the email account used to send alerts. |
| recipient | STRING | Email address of the alert recipient. |
| logLevelFilter | STRING vector | Filters by log level. |
| whitelist | STRING vector |
Use “like” to filter the required logs based on content, with higher priority. Configure only when a whitelist is required. For example, ["%whitelist error%"] matches logs containing “whitelist error”. |
| blacklist | STRING vector |
Use “like” to filter out unwanted logs based on content, effective after the whitelist. Configure only when a blacklist is required. For example, ["%blacklist error%"] excludes logs containing “blacklist error”. |
| generateEmailFunc | HANDLE |
Function for customizing email content. Parameters:
Return value: A tuple, where the first element is a string representing the email subject, and the second element is a string representing the email body. For example:
|
| sendEmailInterval | INTEGRAL | The minimum time interval for sending emails, in milliseconds. If not configured or set to 0, the email will be sent immediately when an alert log is triggered. |
| enableStdSMTPMsg | BOOLEAN | Whether to use the standard SMTP format to send messages. |
4. Interface References
4.1 initConfig
Parameter:
- config: A dictionary, refer to 3. Configuration References for details.
Run the initConfig interface first to initialize a
shared dictionary named logAnalyserConfig as the global configuration for the
tool.
This interface cannot be run repeatedly. To modify the configuration,
either directly change the value of a specified key in the shared dictionary
(e.g., logAnalyserConfig["version"] = "2.00.12"), or undefine
the shared dictionary using undef("logAnalyserConfig", SHARED)
and then re-run the initConfig.
4.2 readLog
Reads logs. Based on the read mode configured in the logAnalyserConfig, logs are
read into the stream table specified by originLogLinesTbName. In batch
processing mode, logs from the folder specified by logDir are
read into the stream table. In stream processing mode, logs from all nodes in
the cluster are read into the stream table.
The result stream table is as follows:
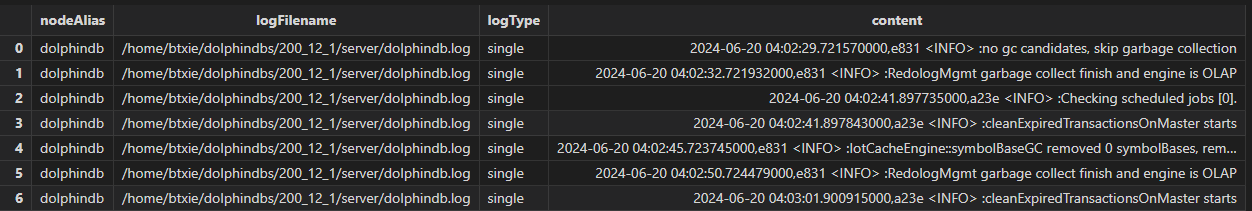
Field Description:
|
Field Name |
Type |
Description |
|---|---|---|
| nodeAlias | STRING |
|
| logFilename | STRING | The path of the log file |
| logType | SYMBOL |
Log types:
|
| content | BLOB | Raw log content |
4.3 parseLog
Parses the read logs. This interface subscribes to the stream table specified by originLogLinesTbName, calls the parsing projects configured in the global configuration dictionary for parsing, and then outputs the result to the stream table specified by resultTbName. For details, refer to 5.1 Customized Parsing below.
The result stream table is as follows:
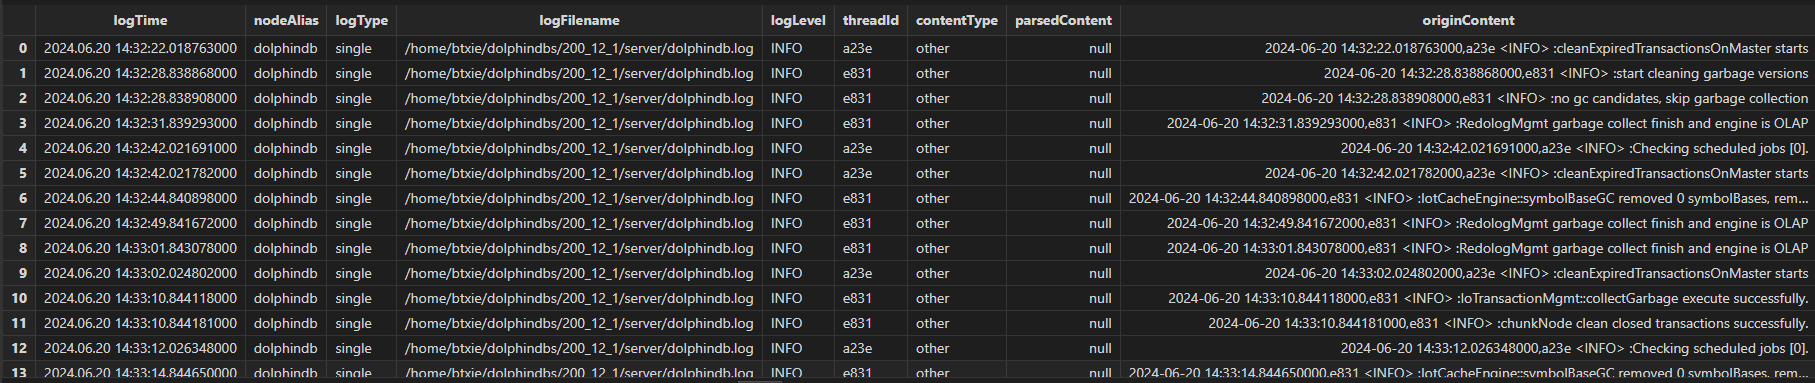
Field Description:
|
Field Name |
Type |
Description |
|---|---|---|
| logTime | NANOTIMESTAMP | Log timestamp |
| nodeAlias | STRING |
|
| logType | SYMBOL |
Log types:
|
| logFilename | STRING | The path of the log file |
| logLevel | SYMBOL | Log levels: DEBUG, INFO, ERROR, and WARNING |
| threadId | STRING | The ID of the logging thread |
| contentType | SYMBOL | Log types: Transaction, startup, and shutdown |
| parsedContent | BLOB | Parsed log content (JSON string) |
| originContent | BLOB | Raw log content |
4.4 generateReport
Generates report tables based on the parsed log results. Used in batch processing mode. Implemented by running methods in the reportGenerator/projects directory that match the file names. For details, refer to 5.1 Customized Parsing.
4.5 initAlertGenerator
Subscribes to the parsed result stream table and sends alert emails to the specified email address. Used in stream processing mode.
Note: SMTP must be enabled for the email.
For details, refer to 5.3 Customized Alerts.
4.6 clearEnv
Clears all related stream tables, subscriptions, background tasks, according to the global configuration dictionary, and then clears the global configuration dictionary.
5. Advanced Usage
This chapter introduces implementing custom log analysis.
5.1 Customized Parsing
The directory structure of logParser is as follows:
.
├── logParser.dos
└── projects
    ├── controller
    │   └── parseTransactionsInfo.dos
    └── datanode
        └── parseTransactionsInfo.dos
The logParser.dos file contains the entry method
parseLog, which, when executed, loads all module files from the
logParser/projects/controller and logParser/projects/datanode
directories, and runs the methods that share the same names as these files.
For example, in the module
logParser/projects/controller/parseTransactionsInfo.dos, which parses
transaction-related log lines, the method parseTransactionsInfo
is loaded and executed. Parameters are as below:
- logTime: Log timestamp
- logLevel: Log level
- line: The raw content of the log line. It is recommended to specify as mutable to improve performance.
- s: The value of dropna(s.split(" ")), used for extracting information. It is recommended to specify as mutable to improve performance.
Return value: A tuple.
- The first element is a string of user-defined type.
- The second element is a dictionary of parsed information, with customizable fields.
For example:
module DDBLogAnalyser::logParser::projects::datanode::parseTransactionsInfo

def parseTransactionsInfo(logTime, logLevel, mutable line, mutable s) {
  contentType = "transactionCompleted"
  info = {"completedTime": logTime,"tid": getTid(s),"cid": getCid(s)}
  return (contentType, info)
}Note: If logParserProjects is configured, parseTransactionsInfo should be included.
5.2 Customized Reports
The directory structure of logParser is as follows:
.
├── projects
│   └── generateTransactionsReport.dos
└── reportGenerator.dos
The reportGenerator.dos contains the entry method
generateReport. which, when executed, loads all module
files from the reportGenerator/projects directory and runs the methods
that share the same names as these files.
For instance, in the module
reportGenerator/projects/generateTransactionsReport.dos, which
generates transaction-related reports, the method
generateTransactionsReport is loaded and executed, with no
input parameters or return values. It is currently designed to share reports
within the method itself.
For example:
def generateTransactionsReport() {
    rolledBackTransactions = generateRolledBackTransactionsReport()
    if (!isVoid(rolledBackTransactions)) {
        share(rolledBackTransactions, "rolledBackTransactions")
    }
}Note: If reportGeneratorProjects is configured, generateTransactionsReport should be included.
5.3 Customized Alerts
Alert-related rules are primarily configured through the alertConfig configuration item, supporting both blacklist and whitelist modes. It also allows customization of alert email subjects and content. For details, refer to the description of alertConfig in 3. Configuration References.
For example, to customize the alert email content to include the string “custom”:
def customGenerateEmailFunc(alertMsg) {
    h = "custom alert!\n"
    ret = exec string(originContent) from alertMsg
    ret = concat(ret, "\n")
    subject = "Custom alert from DolphinDB log analyser!"
    body = h + ret
    return (subject, body)
}

alertConfig = dict(STRING, ANY)
alertConfig["userId"] = "xxx@xxx.com" // Alert sending email account
alertConfig["pwd"] = "xxxxxx" // Alert sending email password
alertConfig["recipient"] = "xxx@xxx.com" // Alert recipient email
alertConfig["logLevelFilter"] = ["DEBUG"] // Filters by log level
alertConfig["whitelist"] = ["%whitelist error%"] // Use like to filter logs by content, with priority given to matching
alertConfig["blacklist"] = ["%blacklist error%"] // Use like to filter unwanted logs by content, effective after the whitelist
alertConfig["generateEmailBody"] = customGenerateEmailBody
config["alertConfig"] = alertConfig
6. Log Analysis Examples
Please refer to 2.1 Batch Analyzing Logs to run the batch process on which the subsequent operations in this section will be based.
6.1 Troubleshooting Transaction Rollbacks
When data loss occurs in a table due to a transaction rollback, instead of command-line tool which individually searches for rollback-related logs, batch process is more efficient and readable, and the generated table rollbackTransactionsReport is shown below:
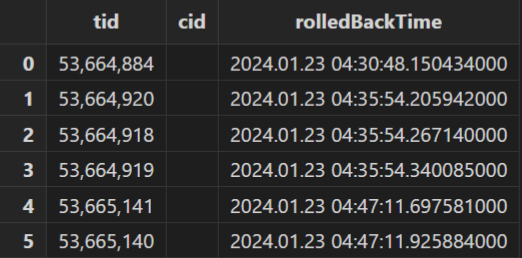
There are 6 transaction rollbacks. Write the following script to iterate over and query the ERROR and WARNING logs containing the rollback transaction IDs and print them:
tids = exec tid from rolledBackTransactions
for (tid in tids) {
    pattern = "%" + tid + "%"
    info = select * from errors where originContent like pattern
    if(info.size() > 0)
        print("\nTransaction " + tid + " relative errors:\n", info["originContent"])
    info = select * from warnings where originContent like pattern
    if(info.size() > 0)
        print("\nTransaction " + tid + " relative warnings:", info["originContent"])
}
The WARNING log here indicates that the rollback of transaction (ID: 53664920) might be due to a full disk.
6.2 Troubleshooting Write Volumes
If a daily data imported to a distributed table resulted in unexpected data volume or long import times, use the log analysis tool to check the write volume. Execute batch process and generate transactionAuditReport and transactionMetricsReport, and then query the hourly number of DDL operations per hour for the specified database:
select count(*) as DDLCount from transactionAuditReport where dbName
	= "dfs://TL_Level2_merged" group by dbName, date(logTime), hour(logTime)
	as date order by DDLCount desc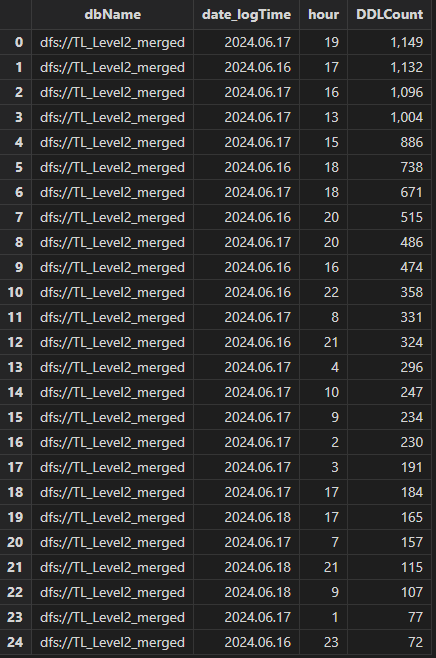
The number of DDL operations on the database dfs://TL_Level2_merged on the 16th and 17th is significantly higher than on the 18th.
Then execute the following query to count the hourly number of partitions for the specified database:
select sum(partitionCount) from transactionMetricsReport left join transactionAuditReport on
	transactionMetricsReport.tid == transactionAuditReport.tid where dbName =
	"dfs://TL_Level2_merged" group by dbName, date(startTime) as date,
	hour(startTime) as hour order by sum_partitionCount desc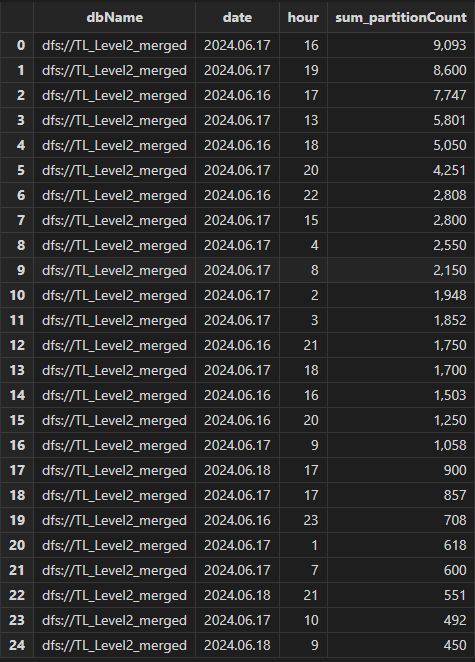
The number of partitions for the database dfs://TL_Level2_merged on the 16th and 17th is significantly higher than on the 18th.
It can be concluded that the repeated submission of some import tasks on the 16th and 17th leads to slower concurrent writes.
6.3 Troubleshooting Misoperations
Note: It is recommended to configure the Audit Log to view all transaction operations on distributed tables. This section applies to cases where the audit log is not enabled or the audit logs have been automatically deleted.
Taking duplicate writes as an example, execute batch process and generate the transactionAuditReport table, as shown below:

The table records all users' write transactions. There are two records for the operation savePartitionedTable on the table Trades of the database dfs://rangedb_tradedata, with log times rather close. Through userName and remoteIP, you can contact the user for further investigation.
6.4 Troubleshooting Long-running Transactions
When there are issues with writes performance, investigate long-running transactions and the tables they write to, and then analyze the code involved. Generate the table longestTransactionsReport, as shown below:
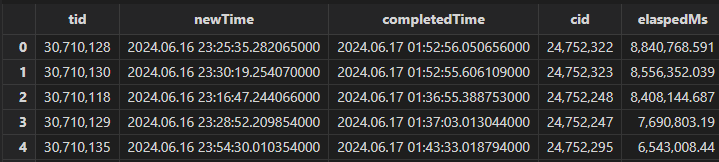
The transaction with ID 30710128 took the longest time. Then query the table transactionAuditReport for audit logs:
select * from transactionAuditReport where tid == 30710128
The transaction’s contentType is savePartitionedTable, indicating it is a write transaction. Then by checking logTime, userName, and remoteIP, you can identify and contact the user, and further investigate whether the write method and data volume are within reasonable limits.
6.5 Troubleshooting Startup Failures, Shutdown Failures, and Crashes
When a node fails to start, stop, or crashes, check whether there are any ERROR or WARNING logs before the issue occurred. Through batch process, analyze the logs and generate report startupAndShutdownReport:

The meaning of contentType values:
- startupInitializing: Node startup has begun.
- startupCompleted: Node startup has completed.
- startupFailed: Node startup failed. The 10 most recent ERROR and WARNING logs are automatically added before logs with contentType=startupFailed.
- shutdownReceivedSignal: The node received a kill signal.
- shutdownStarted: Node shutdown has started.
- shutdownCompleted: Node shutdown has completed.
- shutdownFailed: Node shutdown failed. The 10 most recent ERROR and WARNING logs are automatically added before logs with contentType=shutdownFailed.
- coredump: The node may experience a coredump crash. The 10 most recent ERROR and WARNING logs are automatically added before logs with contentType=coredump.
Since no explicit log entry is generated to indicate a coredump, the coredump record is inferred based on predefined rules. To confirm whether a coredump occurred, check for the presence of coredump files and review operating system logs (e.g., dmesg, /var/log/messages) around the log time. Further investigation of the coredump stack trace and the operations performed before the crash is required to determine the cause.
For logs with contentType=startupFailed, review the previous ERROR logs. In
figure 6-8, the error message is Invalid license file. Upon
further inspection of the license, it was found to be expired, causing the
startup failure.
6.6 User Login Statistics
Use batch processing mode to analyze the logs and generate the loginReport, as shown below:
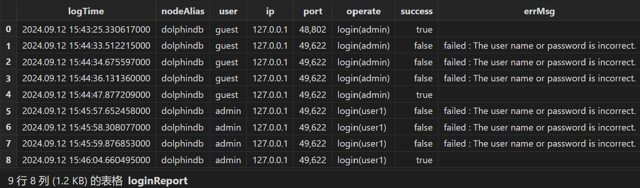
Execute the following SQL query to count the daily logins for each user:
select count(*) from loginReport group by date(logTime) as date, operate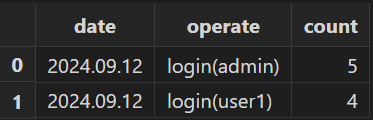
6.7 Filtering Out Logs
When there is long-term, high-volume writing in the system, the large number of
transaction logs can interfere with troubleshooting other issues. To filter out
these logs, query the result table and use the like keywordto
exclude logs where contentType starts with “transaction”:
t = select * from logAnalysisResult where contentType not like "transaction%"To filter out other types of logs, refer to 5.1 Customized Parsing for the parsing scripts, and then use the same method to exclude them.
6.8 Generating Daily Log Analyser Reports
Generate daily log analyser reports through the scheduled jobs and HttpClient plugin, and send them to a specified email address. Refer to the example:
try { loadPlugin("HttpClient") } catch(err) { print(err) }
go
clearCachedModules()
go
use DDBLogAnalyser::config
use DDBLogAnalyser::logReader
use DDBLogAnalyser::logParser::logParser
use DDBLogAnalyser::reportGenerator::reportGenerator
use DDBLogAnalyser::alertGenerator
go
def analyseLogAndSend(userId, pwd, recipient) {
clearEnv()
go
batchModeVersion = version()
config = getExampleConfig(batchModeVersion)
config["logDir"] = getLogDir()
config["startTime"] = temporalAdd(now(), -24H)
config["endTime"] = now()
initConfig(config)
go
readLog()
parseLog()
generateReport() // For batch processing
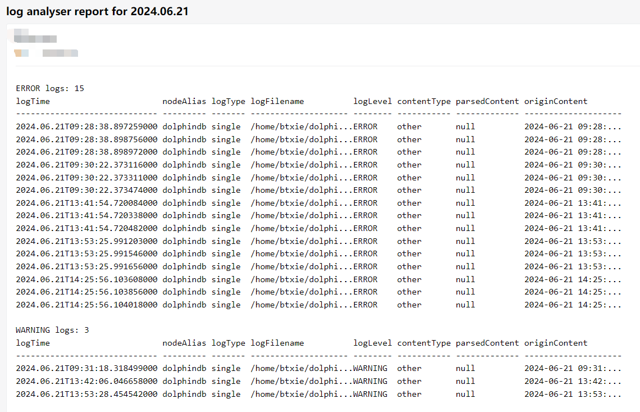
body = "<pre>"
body += "ERROR logs: " + string(exec count(*)
from objByName("errors")) + "\n" + string(objByName("errors"))
body += "\nWARNING logs: " + string(exec count(*)
from objByName("warnings")) + "\n" + string(objByName("warnings"))
body += "</pre>"
res = HttpClient::sendEmail(userId, pwd, recipient,
"log analyser report for " + string(today()), body);
go
clearEnv()
}
scheduleJob("analyseLogAndSend", "analyseLogAndSend",
analyseLogAndSend{"xxxx@xxx.com", "xxxxxxxx", "xxxxx@xxx.com"},
23:55m, today(), 2055.12.31, 'D')The scheduled jobs run every day at 23:55, parsing the standalone logs to generate a report and sending the information of ERROR and WARNING logs to a specified email.