Best Practices for Log Monitoring in DolphinDB
Efficient log monitoring is key to maintaining stability in complex big data systems. DolphinDB, a high-performance time-series database, requires real-time log analytics to support high availability (HA) operations. This guide introduces a lightweight monitoring solution built on Loki, Promtail, and Grafana. It covers system deployment, multi-node configuration, log label extraction, alert rule definition, and common issue diagnosis.
With low storage overhead and high scalability, the solution enables rapid anomaly detection and efficient operations in latency-sensitive environments such as finance and IoT.
1. Architecture Overview
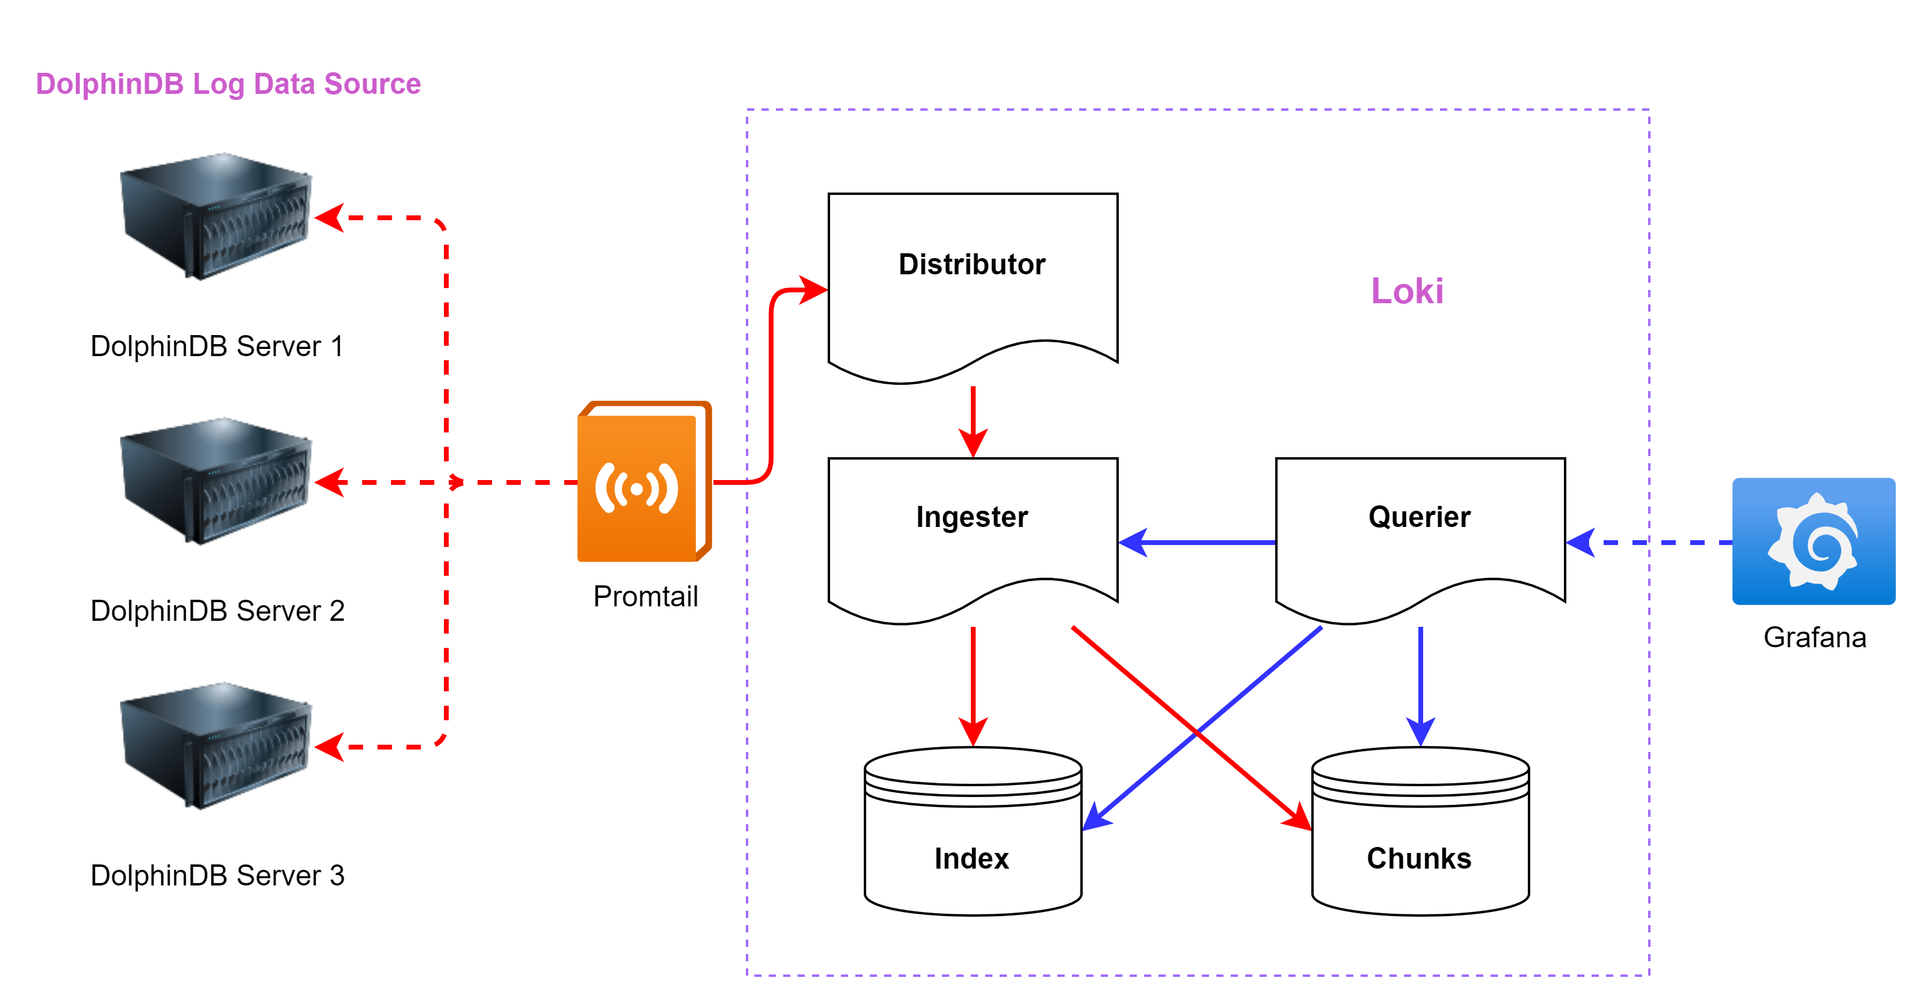
A typical Loki monitoring architecture comprises three core components: Promtail, Loki, and Grafana.
- Promtail acts as the log collection agent. It reads logs from local sources (such as DolphinDB datanode), attaches metadata labels for classification, and streams logs to Loki via HTTP.
- Loki serves as the centralized log aggregator. It ingests and indexes logs based on labels rather than full-text content, enabling efficient storage and fast retrieval.
- Grafana offers visualization, query interfaces, and alerting dashboards.
The architecture diagram (Figure 1-1) illustrates the data flow: red arrows represent log ingestion, while blue arrows indicate query and alert flows.
1.1 Promtail Overview
Promtail is a lightweight log forwarder typically deployed on each monitored node. It supports the following features:
- Discover and collect logs from local files or systemd journals (for ARM and AMD64 platforms).
- Attach metadata as labels to log streams.
- Push labeled logs to a designated Loki instance.
Log File Discovery
Before Promtail can push log data to Loki, it must first understand the logging environment. This involves identifying which applications are writing logs and determining which log files should be monitored.
Although Promtail uses Prometheus-style service discovery, its local daemon mode limits cross-node discovery. In Kubernetes environments, Promtail integrates with the Kubernetes API to enrich logs with pod and container metadata, enabling scalable log routing in distributed systems.
Configuration
Promtail is configured using stanzas, allowing fine-grained control over log sources, filters, and label enrichment. For advanced configuration, refer to the Promtail Configuration Guide.
1.2 Loki Overview
Loki is an open source log aggregation system developed by Grafana Labs, optimized for cloud-native observability. Unlike traditional log systems, Loki avoids full-text indexing. Instead, it indexes only the log metadata (labels), which makes it more efficient, scalable, and tightly integrated with Prometheus.
Key Characteristics:
- Horizontal scalability: Loki can scale from small deployments (e.g., Raspberry Pi) to petabyte-scale daily log volumes. Its decoupled read/write paths and microservice architecture make it well-suited for Kubernetes.
- Multi-tenancy: Loki supports tenant isolation through label-based scoping and tenant IDs, allowing multiple clients to share a single Loki instance securely.
- Third-Party integration: Loki is compatible with a wide range of log forwarders and observability tools via plugin-based integration.
- Efficient storage: Log data is stored in compressed chunks using object storage backends (e.g., Amazon S3, GCS). Minimal indexing results in significantly reduced storage costs compared to traditional systems.
- LogQL: Loki's query language, LogQL, enables powerful log filtering and metric extraction, bridging the gap between metrics and logs.
- Alerting with ruler: Loki includes a Ruler component for real-time alert evaluation based on logs, integrating seamlessly with Grafana's alert manager and Prometheus Alertmanager.
This tutorial uses Loki V2.5, aligned with the corresponding Grafana version. The following sections detail the deployment and integration process of Loki-based logging for a DolphinDB HA cluster with three data nodes.
2. Environment Setup
Simulated Server Topology
The deployment environment consists of three nodes simulating a distributed DolphinDB cluster. Each node runs DolphinDB components and log monitoring services as shown below:
| IP Address | Hostname | Node Roles | DolphinDB Ports | Monitoring Services | Monitoring Ports |
|---|---|---|---|---|---|
| 10.0.0.80 | vagrant1 | controller, agent, datanode, computenode | 8800, 8801, 8802, 8803 | Grafana, Loki, Promtail |
3000, 3100, 9080 |
| 10.0.0.81 | vagrant2 | controller, agent, datanode, computenode | 8800, 8801, 8802, 8803 | Promtail | 9080 |
| 10.0.0.82 | vagrant3 | controller, agent, datanode, computenode | 8800, 8801, 8802, 8803 | Promtail | 9080 |
Software Versions
| Component | Version |
|---|---|
| Grafana | 9.0.5 |
| Loki | 2.5 |
| Promtail | 2.5 |
Note: Ensure Grafana is pre-installed on the monitoring node (vagrant1) before proceeding.
3. Installation and Deployment
Before proceeding, ensure a high availability DolphinDB cluster is already deployed with multiple data nodes. Refer to High-availability Cluster Deployment or Multi-Container Deployment With Docker Compose for setup instructions.
3.1 Installing Loki and Promtail
File Preparation
Download the installation packages (included with this guide):
- loki-linux-amd64.zip → upload to the monitoring server (10.0.0.80)
- promtail-linux-amd64.zip → upload to all DolphinDB nodes (10.0.0.80, 10.0.0.81, 10.0.0.82)
Install Loki on the Monitoring Server (10.0.0.80)
Create the installation directory:
mkdir -p /usr/local/logsCollect/lokiCreate directories for Loki storage and index:
mkdir  /data/loki
mkdir  /data/loki/{chunks,index}
Unzip the Loki binary to the target directory:
unzip loki-linux-amd64.zip -d /usr/local/logsCollect/lokiNavigate to the installation directory and create the configuration file:
cd /usr/local/logsCollect/loki
vim config.yaml
Add the following content to "config.yaml":
auth_enabled: false  # Enable or disable authentication

server:
  http_listen_port: 3100  # HTTP service listening port

ingester:
  lifecycler:
    address: 10.0.0.80  # IP address of the monitoring server
    ring:
      kvstore:
        store: inmemory  # Storage backend for ring metadata. Options: inmemory, consul, etcd
      replication_factor: 1  # Sets the number of data replicas. A value of 1 disables replication.
    final_sleep: 0s  # Wait time before shutdown for graceful termination
  chunk_idle_period: 5m  # Marks a chunk as complete if it receives no logs for 5 minutes
  chunk_retain_period: 30s  # Waits 30 seconds after chunk completion before writing to storage

schema_config:
  configs:
    - from: 2024-04-01  # Effective start date of this schema configuration
      store: boltdb  # Storage backend for index data. Common values: boltdb, cassandra
      object_store: filesystem  # Object store type for chunk storage. Common values: filesystem, s3, gcs
      schema: v11  # Storage schema version used by Loki
      index:
        prefix: index_  # Prefix for index tables
        period: 168h  # Duration covered by each index table (7 days)

storage_config:
  boltdb:
    directory: /data/loki/index  # Directory path for index files
  filesystem:
    directory: /data/loki/chunks  # Directory path for chunk files

limits_config:
  enforce_metric_name: false  # Enforce requirement for metric name label in log streams
  reject_old_samples: true  # Reject log samples older than the allowed time window
  reject_old_samples_max_age: 168h  # Maximum age of accepted log samples (7 days)
  ingestion_rate_mb: 1024  # Global ingestion rate limit in MB/s
  ingestion_burst_size_mb: 2048  # Global burst ingestion limit in MB/s

chunk_store_config:
  max_look_back_period: 168h  # Maximum lookback duration for log queries (must align with index period)

table_manager:
  retention_deletes_enabled: true  # Enable automatic deletion of expired tables
  retention_period: 168h  # Log retention duration (7 days)
Make sure to modify the server IP and listening port to match your deployment environment. By default, Loki enforces an ingestion rate limit of 4 MB/s. Without proper configuration, high log volume may trigger rate limit errors. The above configuration increases the global ingestion threshold to prevent this.
Run the following command in the installation directory:
nohup ./loki-linux-amd64 -config.file=./config.yaml >./server.log 2>&1 &To stop Loki:
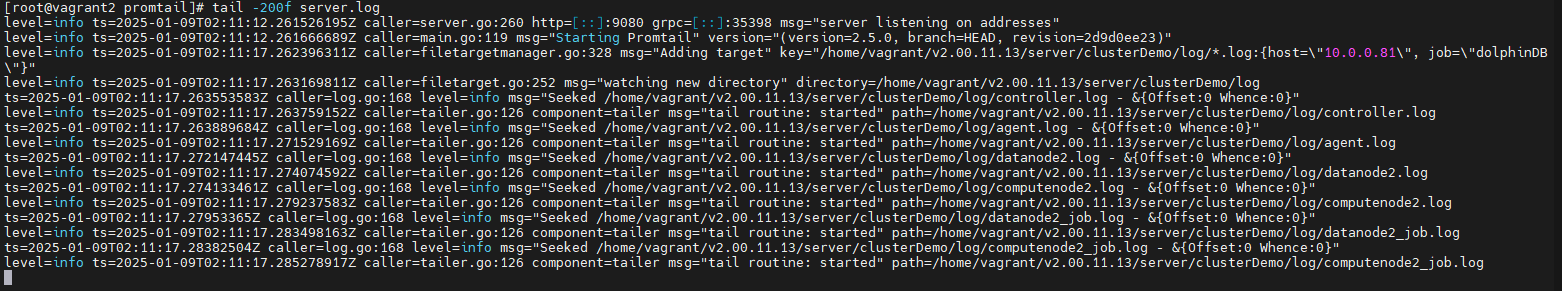
kill -9 $(pgrep -f "loki-linux-amd64")To check logs:
tail -200f server.logOnce started successfully, you should see startup logs similar to Figure 3-1.

Configure Promtail in the DolphinDB HA Cluster
Follow the steps below on each DolphinDB node (10.0.0.80, 10.0.0.81, 10.0.0.82). The following example uses 10.0.0.80.
Create the installation directory:
mkdir -p /usr/local/logsCollect/promtailNavigate to the directory where the installation package is located and extract the Promtail archive:
unzip promtail-linux-amd64.zip -d /usr/local/logsCollect/promtailNavigate to the install directory and create the "promtail.yaml" file:
cd /usr/local/logsCollect/promtail
vim promtail.yaml
Add the following configuration:
server:
  http_listen_port: 9080
  grpc_listen_port: 0

positions:
  filename: ./positions.yaml

clients:
  - url: http://10.0.0.80:3100/loki/api/v1/push  # Loki server URL for pushing logs

scrape_configs:
  # ucenter1
  - job_name: dolphinDB
    static_configs:
      - targets:
          - 10.0.0.80
        labels:
          job: dolphinDB
          host: 10.0.0.80
          __path__: /home/vagrant/v2.00.11.13/server/clusterDemo/log/*.log  # Match all *.log files in directory
    pipeline_stages:
      - regex:
          expression: '^(?P<ts>\d{4}-\d{2}-\d{2}\s\d{2}:\d{2}:\d{2}\.\d+)\s(?P<level><\w+>)\s:(?P<message>.*)$'
      - timestamp:
          source: ts
          format: 2006-01-02 15:04:05.000000
          timezone: "China/Beijing"
      - labels:
          level:
      - output:
          source: message
  - job_name: core_file_monitor
    static_configs:
      - targets:
          - 10.0.0.80
        labels:
          job: core_files
          host: 10.0.0.80
          __path__: /home/vagrant/v2.00.11.13/server/clusterDemo/log/core.*  # Match core.* files
    pipeline_stages:
      - labels:
          filename: __path__   # Extract filename from file path as label
      - output:
          source: filename     # Use filename as log content
      - limit:
          rate: 10             # Max 10 logs per second
          burst: 10            # Allow short bursts of up to 10 logs
drop: true # Drop logs exceeding rate limitsNotes:
job_name: dolphinDBmonitors DolphinDB log output.job_name: core_file_monitortracks core dump file creation.- Adjust
__path__to match your local DolphinDB log directory. - The url under clients should point to the correct Loki server.
- IP addresses in targets and host should reflect the local node where Promtail is running. These are used to identify the log source in Loki.
Execute the following command in the Promtail install directory:
nohup ./promtail-linux-amd64 -config.file=./promtail.yaml >./server.log 2>&1 &Stop promtail:
kill -9 $(pgrep -f "promtail-linux-amd64")Verify startup:
tail -200f server.logIf logs indicate successful startup, proceed to deploy Promtail on the remaining nodes in the cluster.
3.2 Alert Configuration in Grafana
3.2.1 Configure Loki as a Data Source in Grafana
Assuming Grafana is already installed, it is accessible via port 3000.
In this tutorial, Grafana runs on the monitoring server at 10.0.0.80, so the default URL is 10.0.0.80:3000, and the default username and password are both admin.
After logging in, navigate to the "Data Sources" in the Grafana interface:
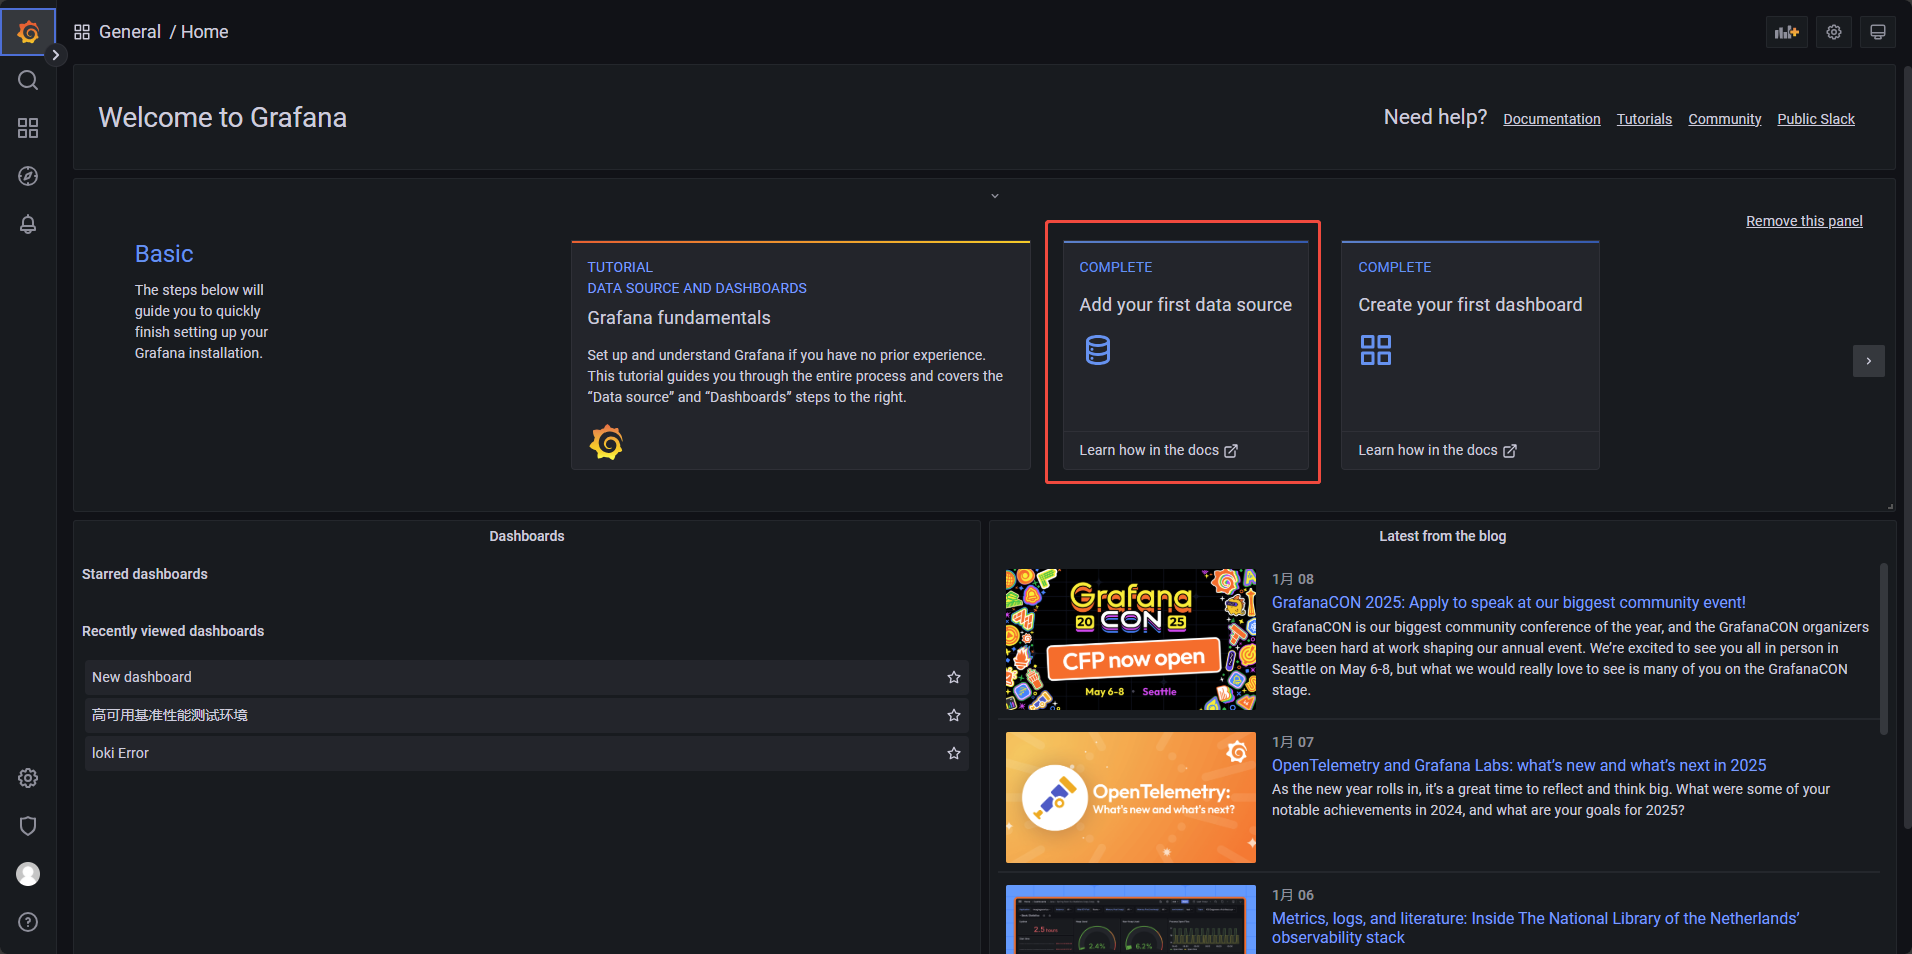
Click "Add data source", then choose Loki from the list, locate the URL field (see figure 3‑4) and enter the following address:
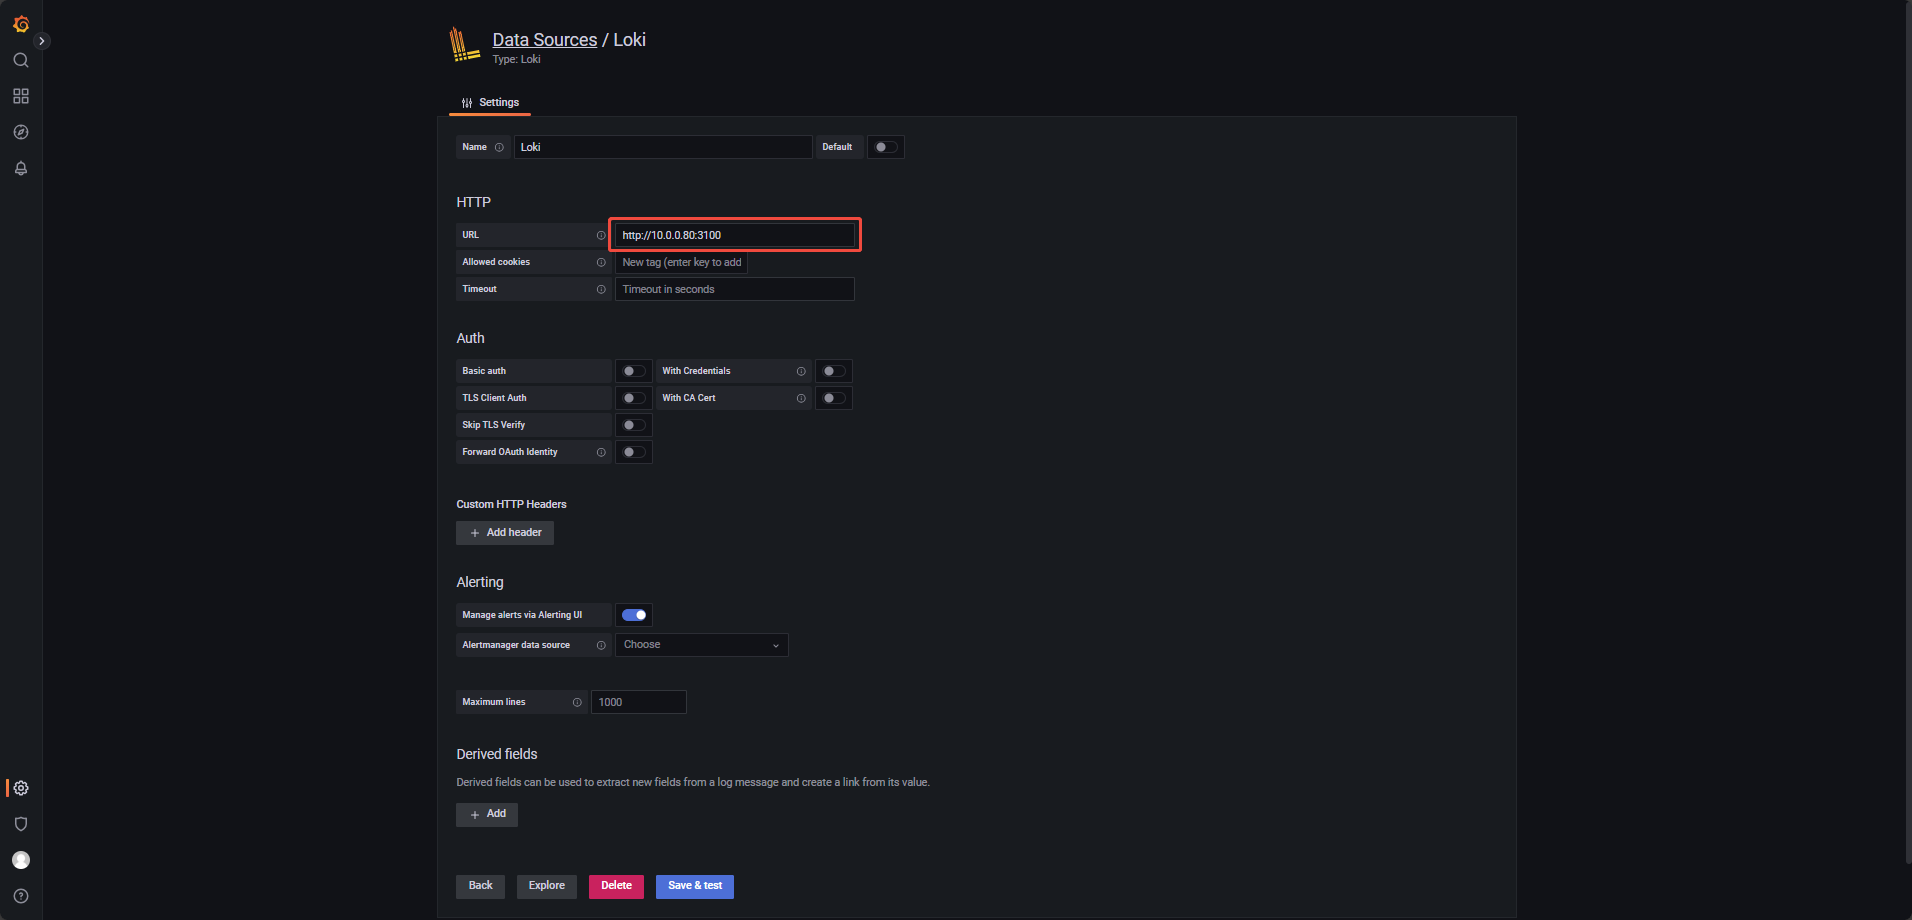
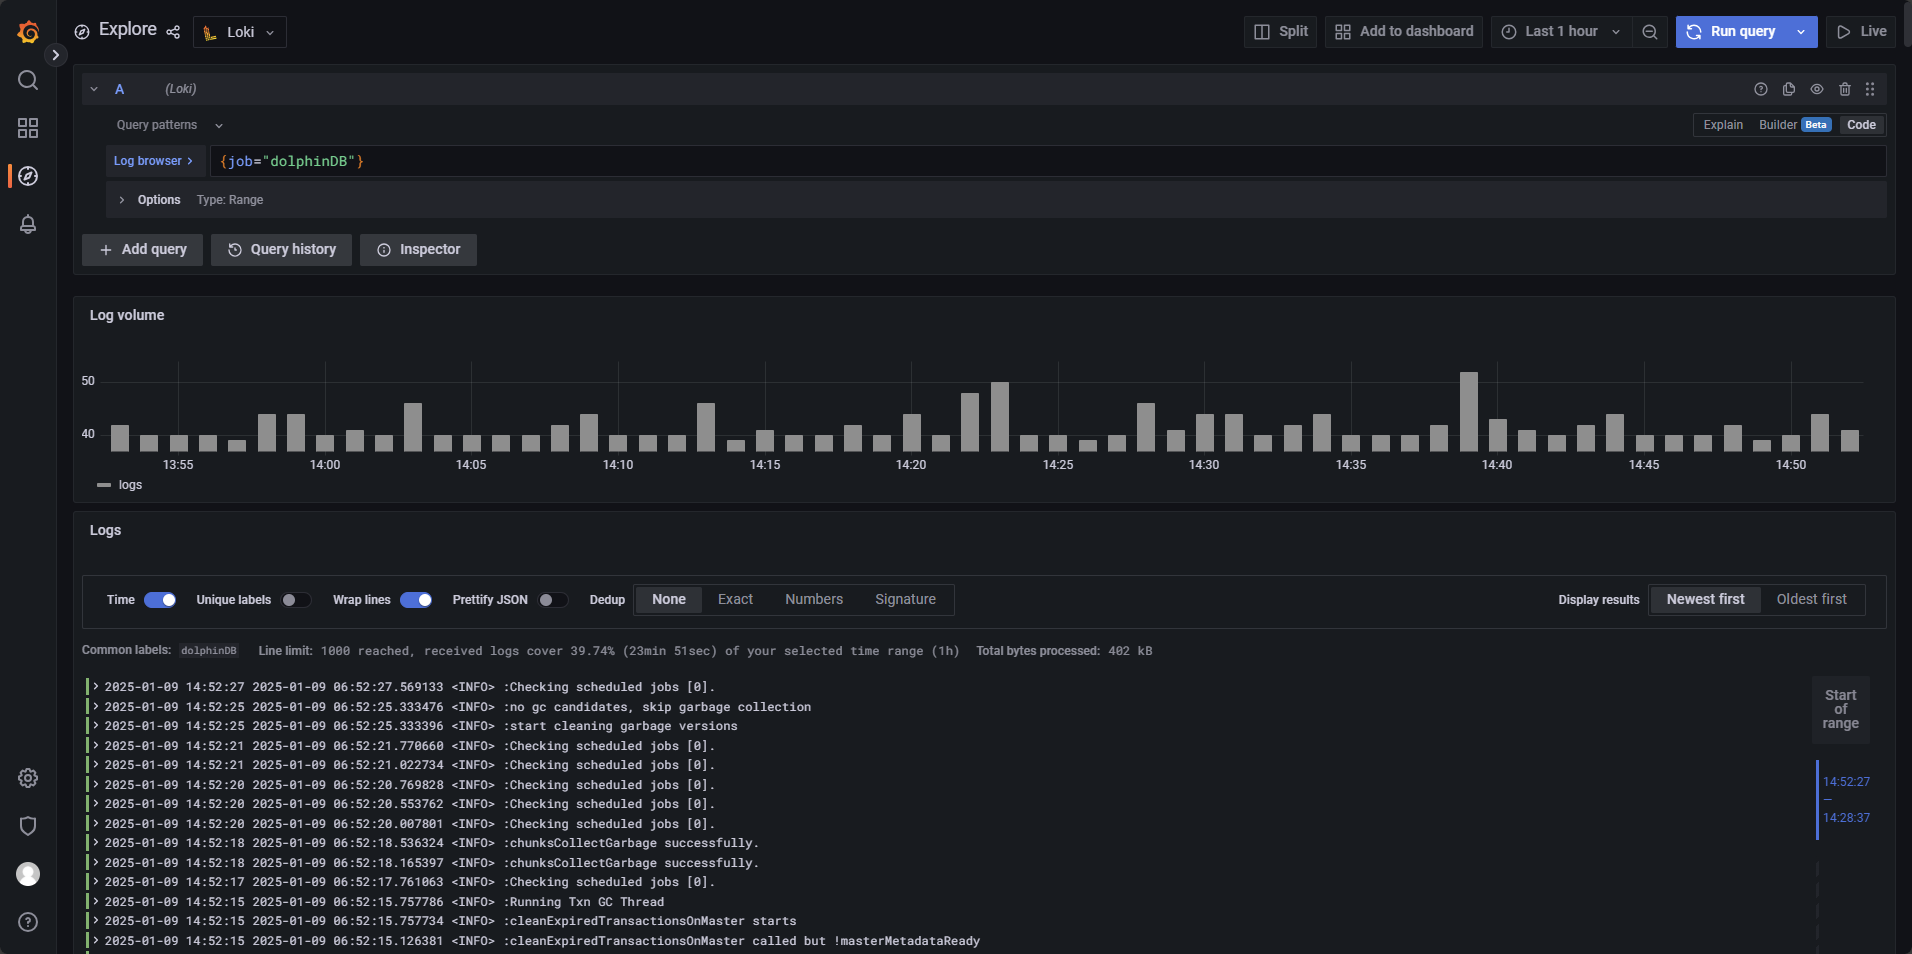
Click "Save & Test" to validate the connection and save the configuration. Go back to the home page and click Explore from the sidebar. In the Data source dropdown, select Loki, click “Log browser”, select the dolphinDB job, then click “Show logs”.
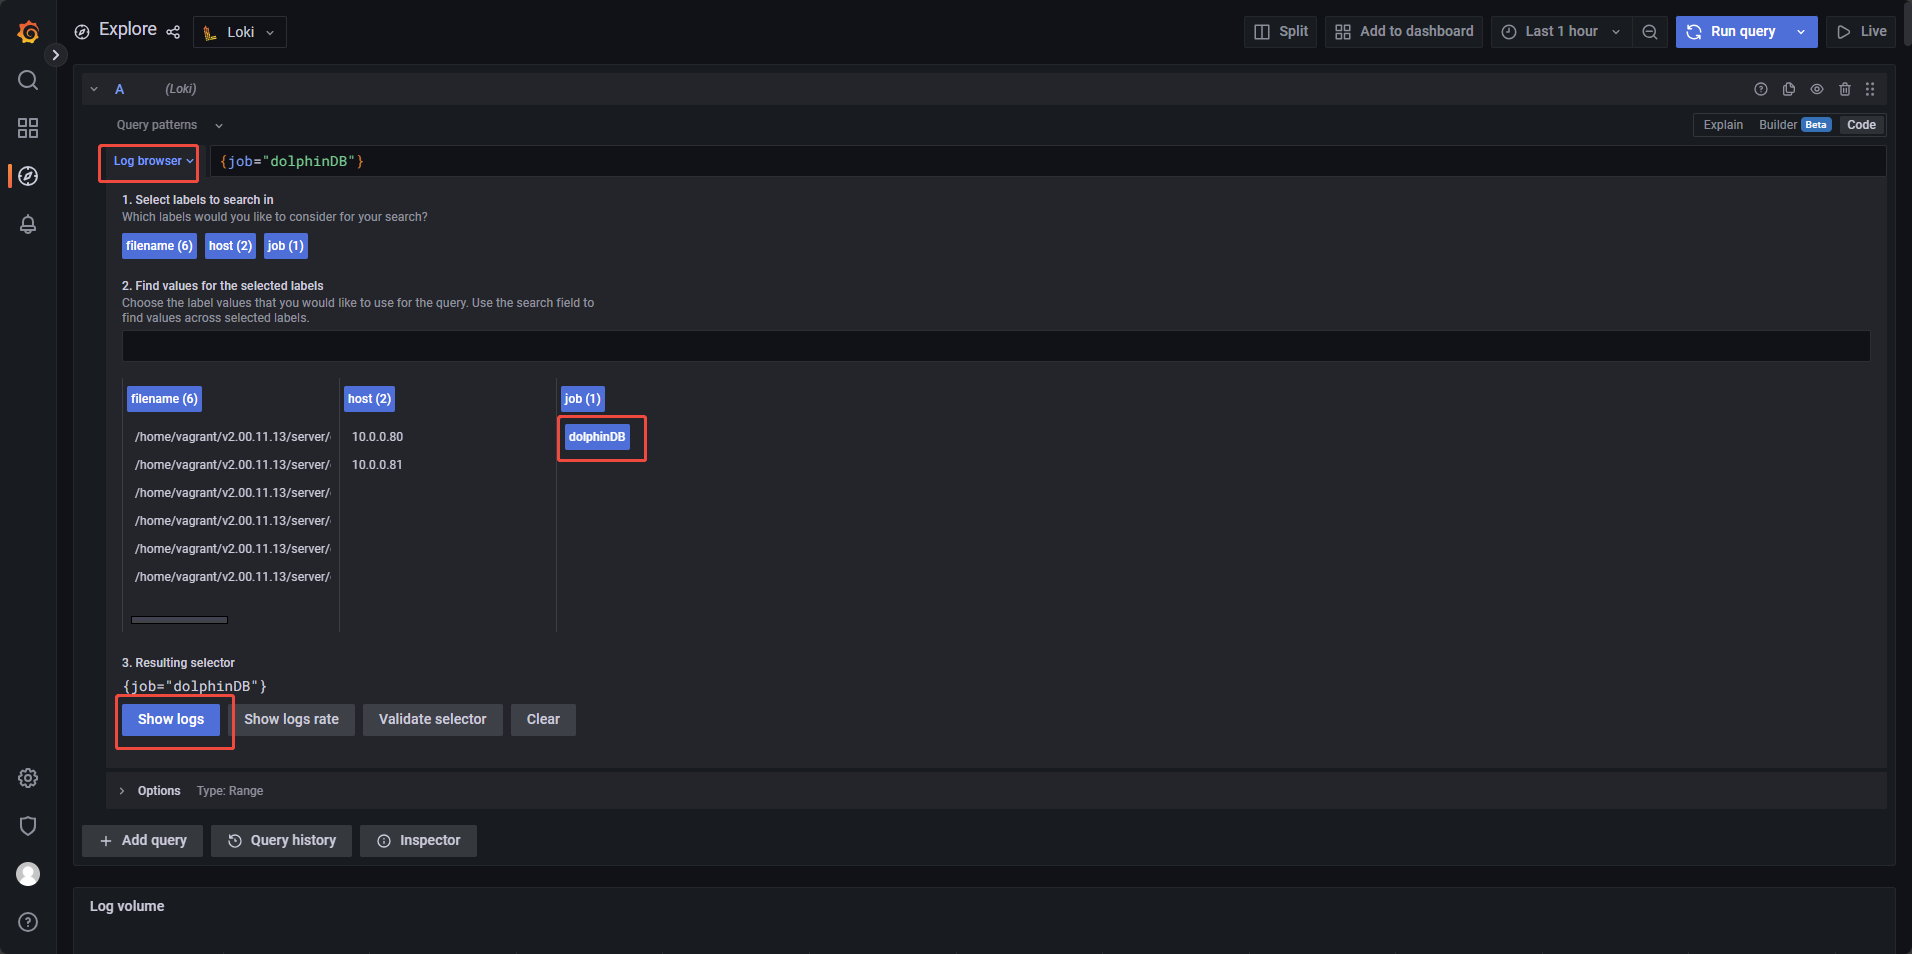
If logs are displayed successfully, the data source is correctly configured. See figure 3‑6 for a sample result.
3.2.2 Alert Panel Configuration in Grafana
This section explains how to configure alert rules in Grafana based on logs collected by Loki. In this example, Loki performs log checks every 1 minute to detect new error messages. Each check scans logs generated within the previous 5 minutes. If any error logs are detected, the system enters a 2-minute evaluation period. If the alert condition persists throughout this period, Grafana triggers an alert (e.g., sends an email notification).
To create a new alert rule, click Alerting → Alert rules on the main sidebar, then click New alert rule (Figure 3‑7):
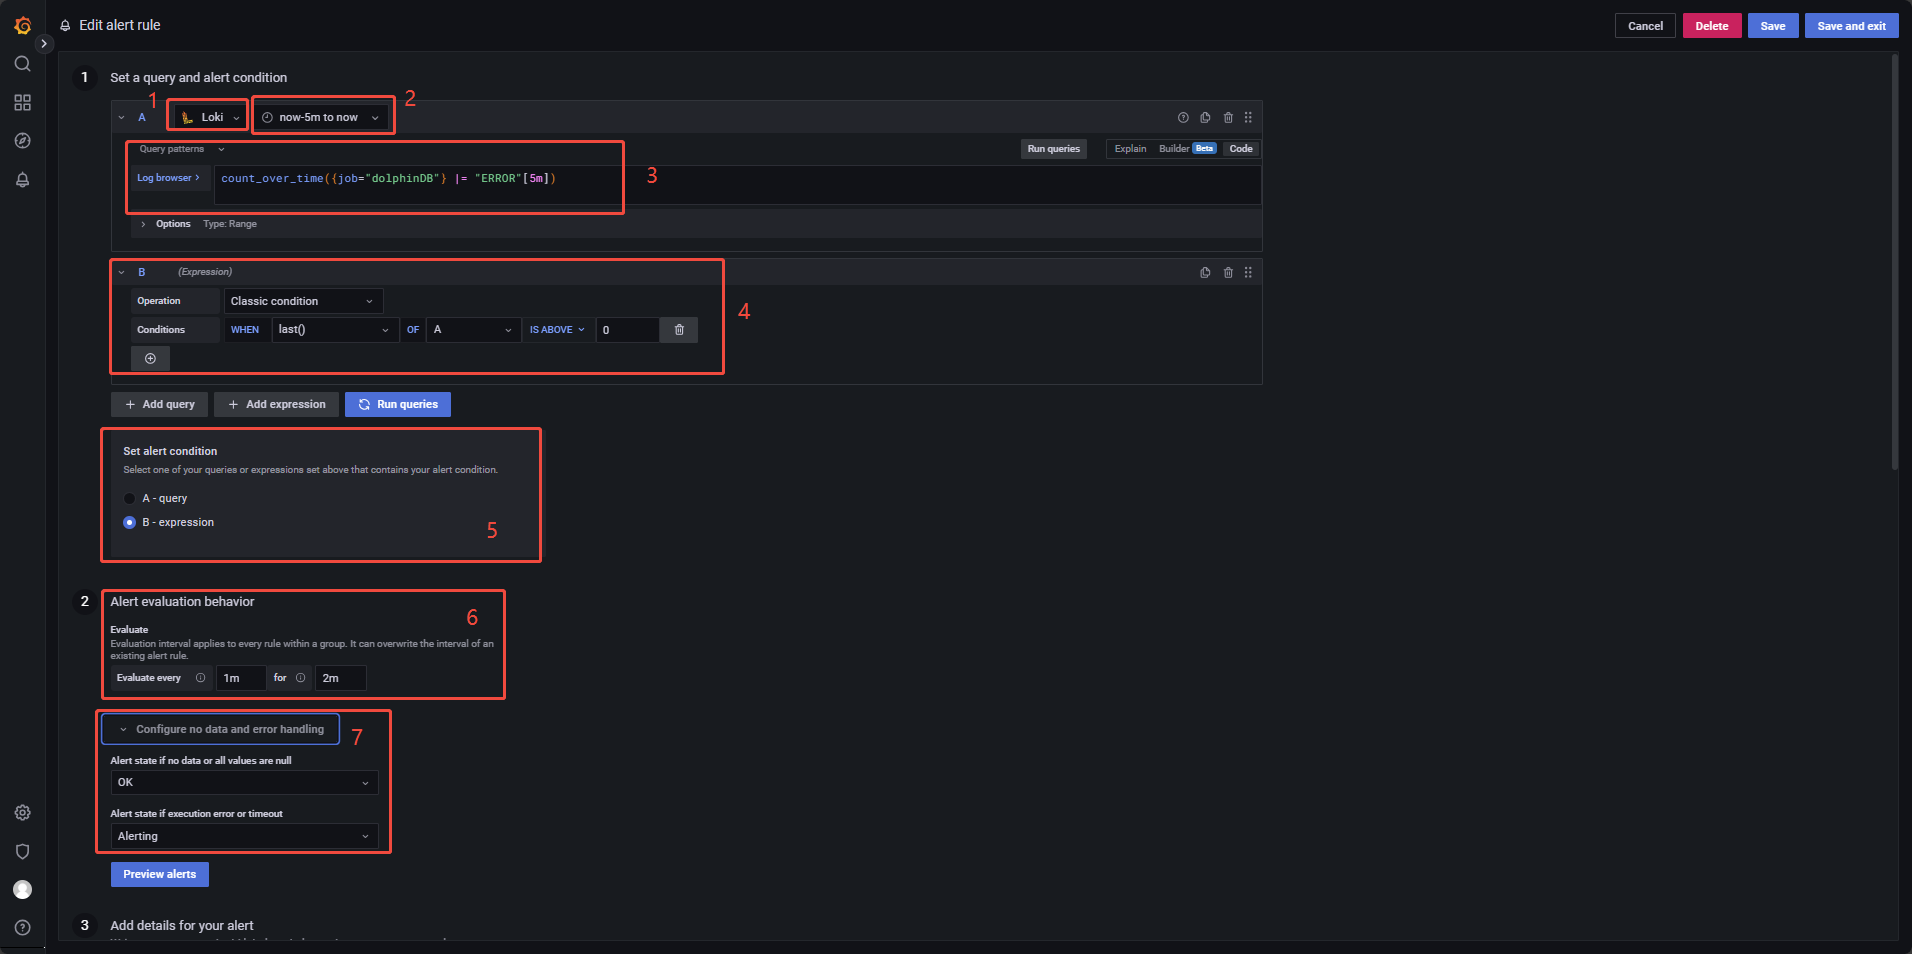
Use the numbered interface elements in Figure 3‑7 to follow the configuration steps below:
- Select the data source: Choose Loki as the data source.
- Set the time range for each evaluation: Configure the query to scan logs from the last 5 minutes during each evaluation cycle.
- Define the query expression: Use
count_over_time({job="dolphinDB"} |= "ERROR"[5m])to count log lines containing "ERROR" within the past 5 minutes. For example, if the current time is 15:25:10, the expression will evaluate logs from 15:20:10 to 15:25:10 and record the result at 15:25:10 (see Figure 3‑8). - Configure the alert condition: Set
WHEN last() OF A IS ABOVE
                                0
, where:last()retrieves the latest value from the query in step 3.IS ABOVE 0triggers the alert if any "ERROR" log entries are detected within the defined time window.
- Apply the expression as the condition: Use the expression from step 4 as the alert condition.
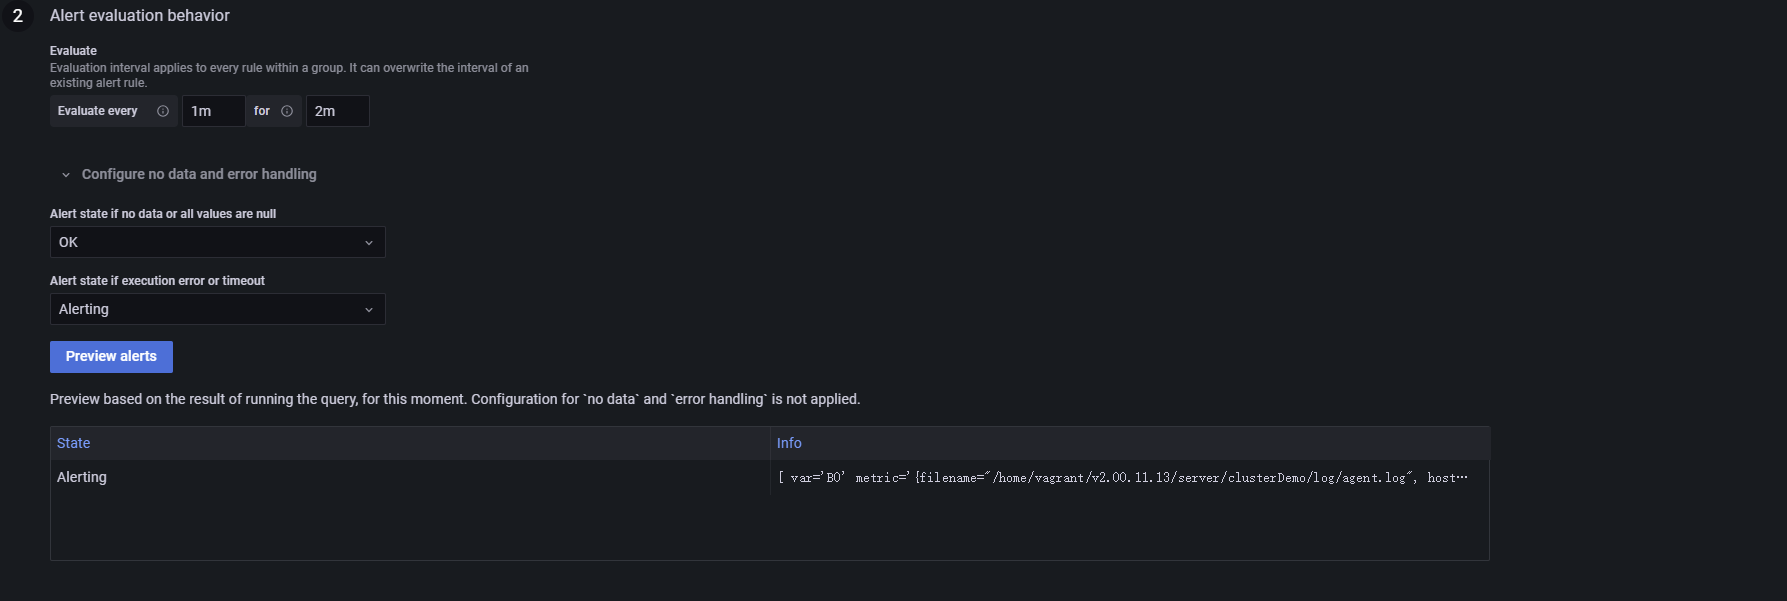
- Configure evaluation frequency and duration: Grafana checks once every
minute.
Evaluate every 1mmeans the check runs every minute.For 2mdefines the alert evaluation window as 2 minutes.
- Handle no data scenarios: If no error logs are generated, the expression in step 3 returns no data, resulting in the "Nodata" state. To prevent false alerts, set Alert state if no data or all values are null to "OK". This ensures that no data does not imply a failure.
Note:
Grafana determines whether to trigger an alert based on a boolean result.
When last() OF A > 0, the expression in step 4 returns
true, initiating the alert evaluation period. If the result is less than or
equal to zero, the alert is not triggered. Since a log query alone returns a
numeric value rather than a boolean, an additional condition expression is
required to convert the query result into a boolean outcome for the alert
system.
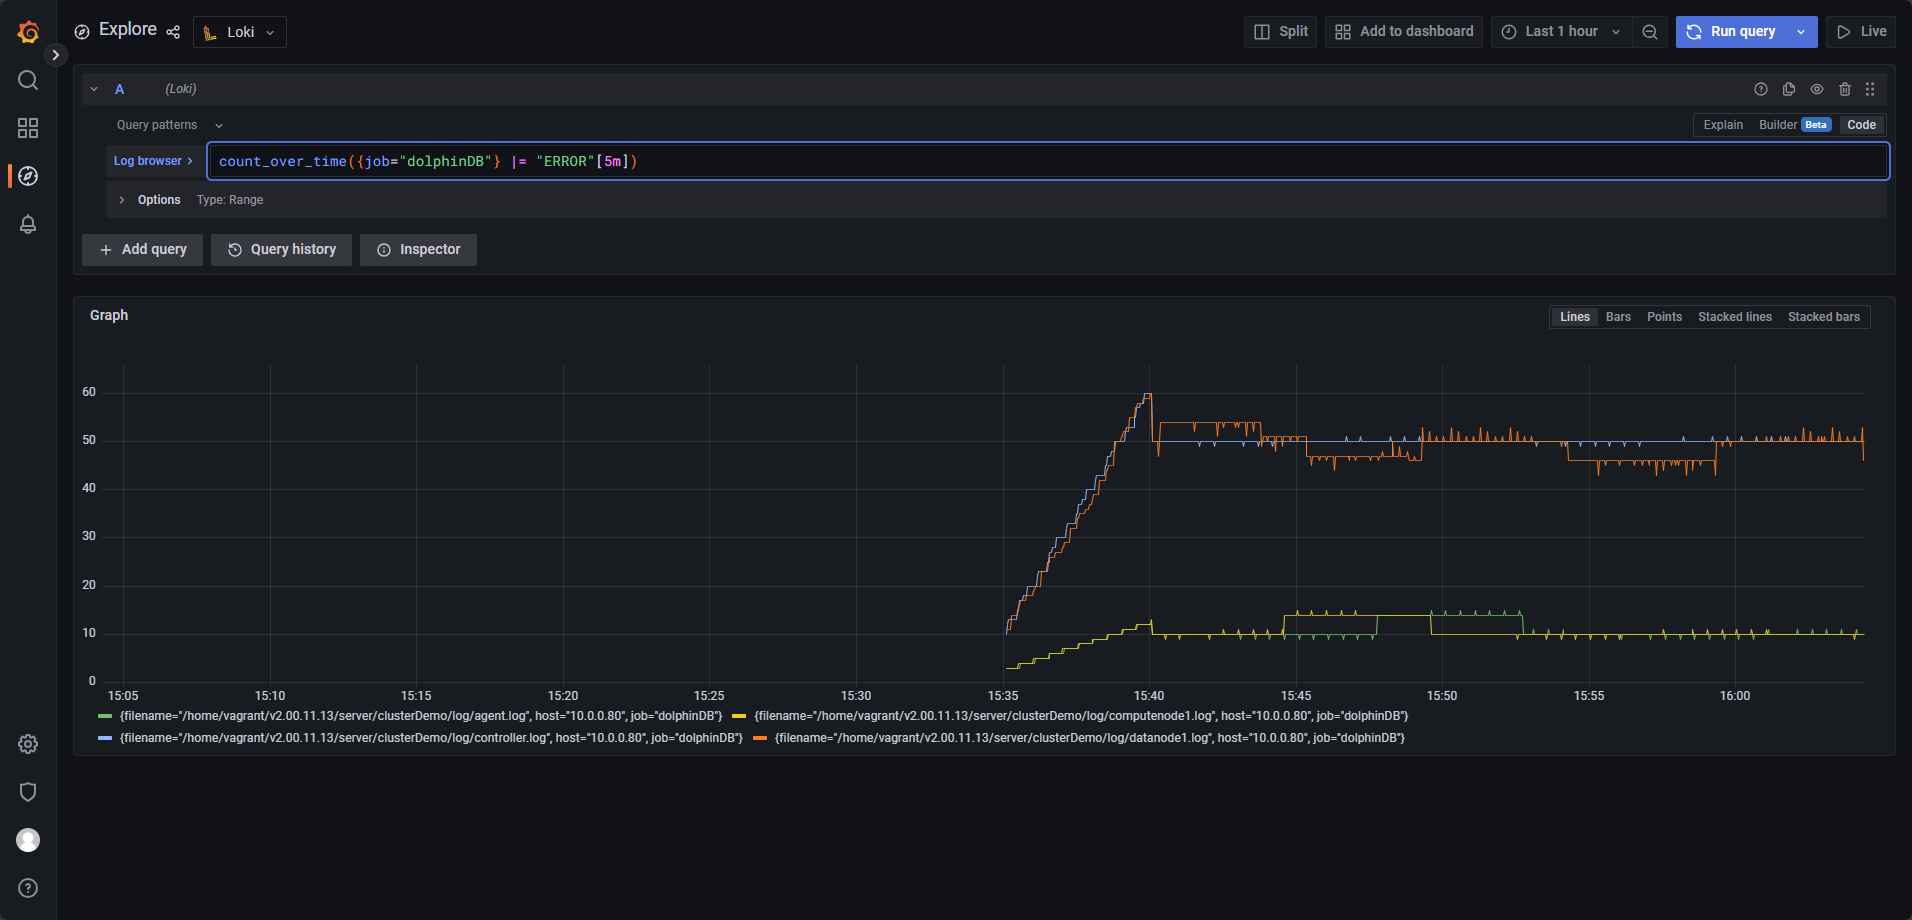
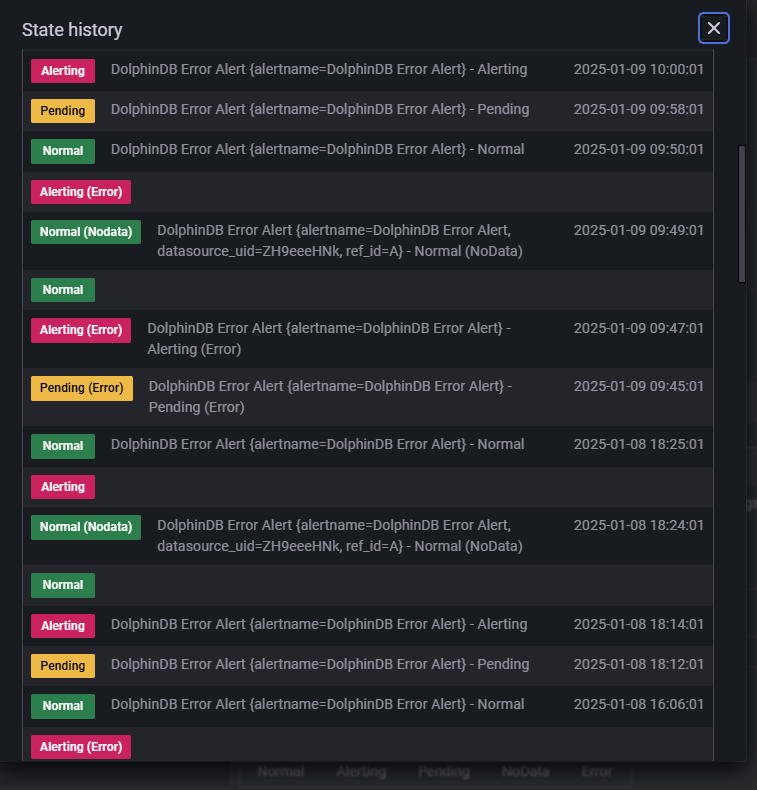
Figure 3-9 illustrates the possible alert rule states:
- Pending: The alert condition has been met, but the system is still within the evaluation period. If the condition remains true throughout this period, the state transitions to "Alerting".
- Alerting: The system has confirmed the anomaly and the alert is actively triggered.
- Nodata: The query expression returned no data.
- Normal: The monitored metric is operating within normal parameters.
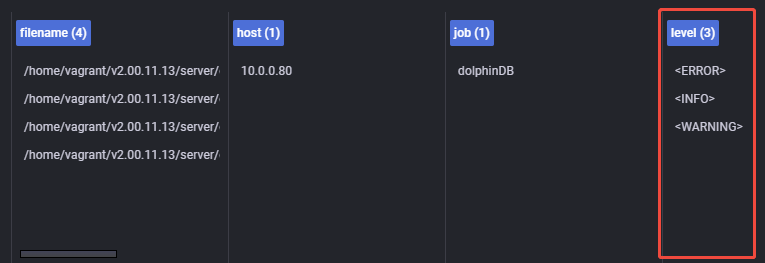
Click Preview Alerts to preview the alert output. In Figure 3‑10, the "Info" column displays labels extracted by Promtail (such as filename, job, and host), which are configured under the "labels" of the Promtail config file (as shown in Figure 3‑5).
You can customize alert names, groups, and other metadata as needed (Figure 3‑11):
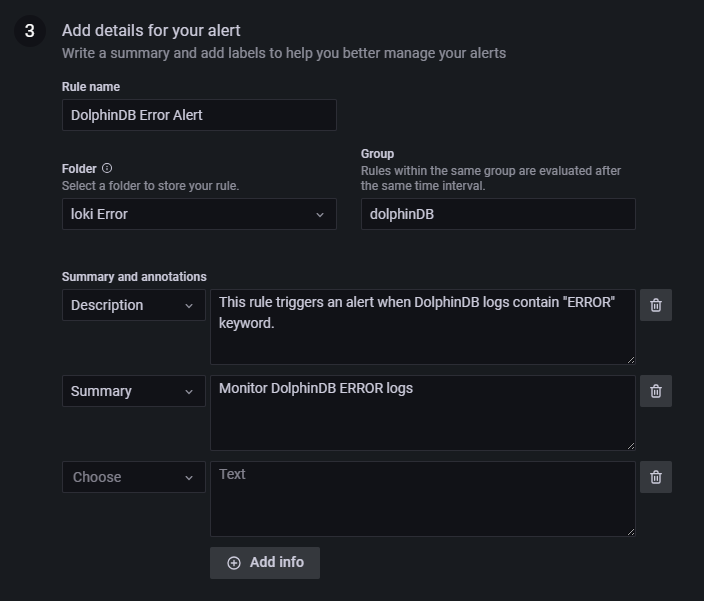
Click Save & Exit to save and exit the configuration.
3.2.3 Alert Email Configuration
To enable email alerts, Grafana must be configured with a valid SMTP server.
Configure the SMTP section in Grafana by editing the "./grafana-9.0.5/conf/defaults.ini" file.
[smtp]
enabled = true
host = smtp.163.com:465             # Specify the SMTP server and port (163 Mail in this example)
user = xxxxxxxxx@163.com            # Use your email address (e.g., a personal 163 Mail account)

password = xxxxxxxx                 # Use the app-specific authorization code (not your login password)
cert_file =
key_file =
skip_verify = false
from_address = xxxxxxxx@163.com     # Same as the user email above
from_name = Grafana
ehlo_identity =
startTLS_policy =Note: If the password includes # or
;, wrap it with triple quotes (e.g.,
"""#password;""").
You may use a custom SMTP server or third-party services such as Gmail. Note that the authorization code is not your email login password—it is an app-specific password that must be generated in your email provider’s security settings. Once SMTP is configured, restart the Grafana service.
Navigate to Alerting → Contact points and click New contact point.
Configure it as shown in Figure 3-12. If you want to include dynamic labels in your alert emails, refer to Template annotations and labels.
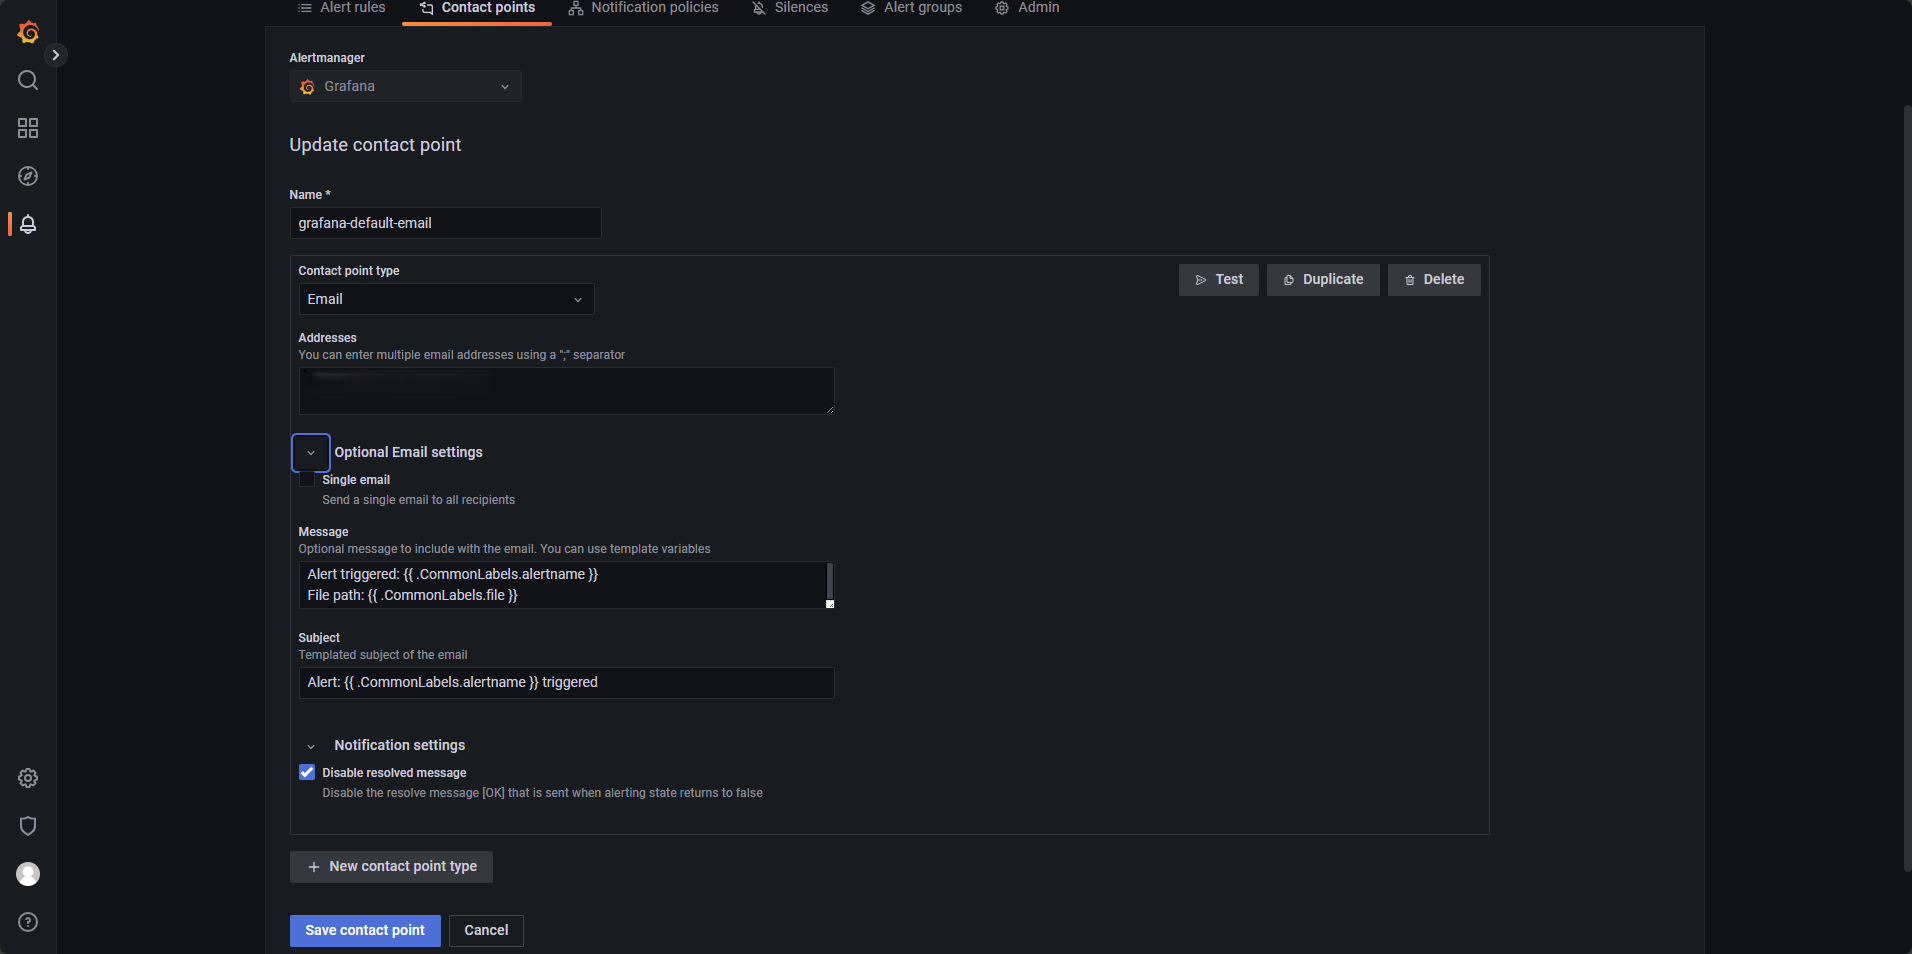
- Addresses: The recipient email address for the alerts.
- Message and subject: Customize the email body and title based on your needs.
- Disable resolved message: When checked, Grafana will not send an additional email when the alert resolves.
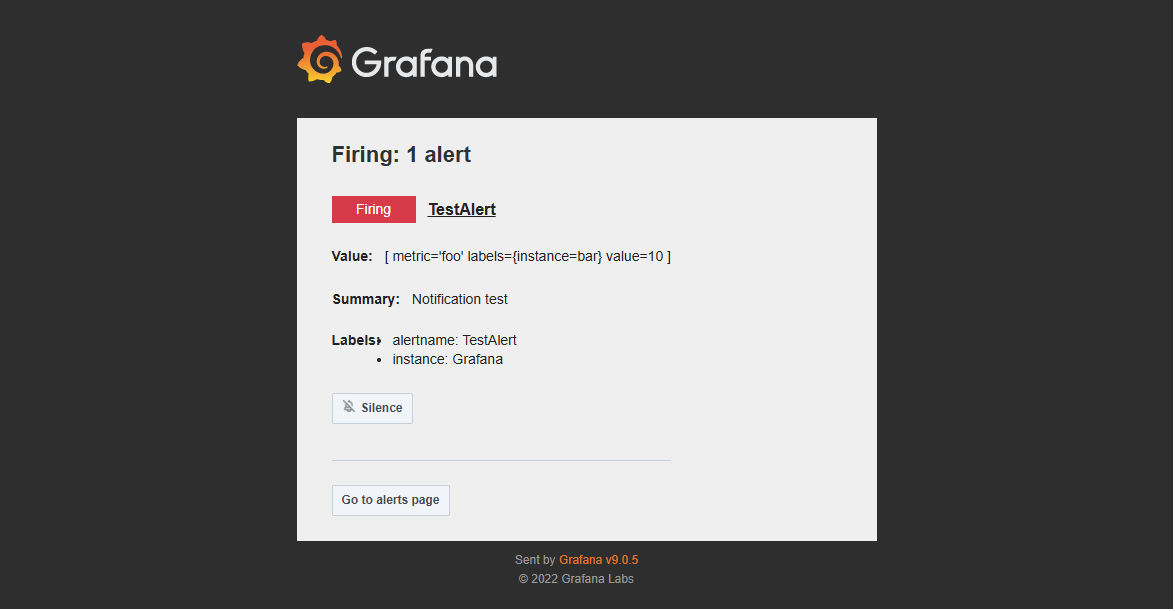
Click Test to verify that emails can be sent correctly. If the setup is correct, a test email will be delivered (see Figure 3-13).
Click Save contact point once confirmed.
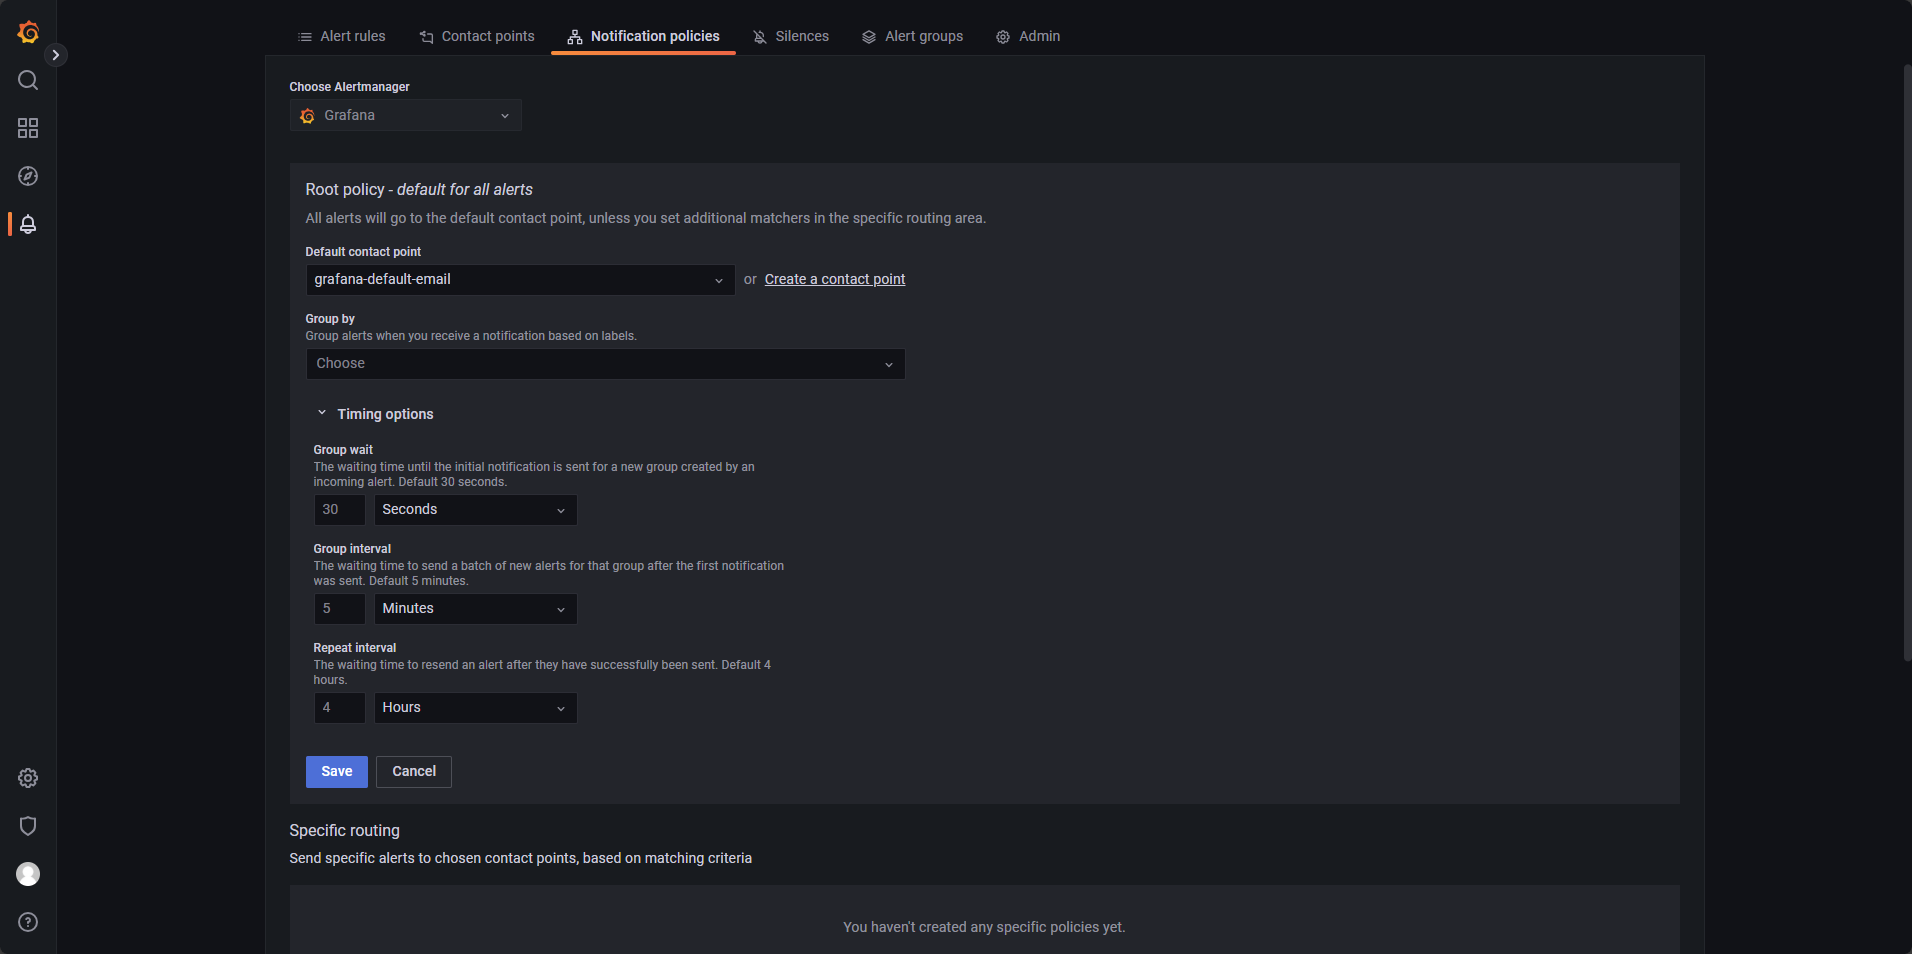
Next, go to Notification policies and assign the previously created contact point as the default. Refer to Figure 3-14 for guidance.
Click Save to apply the policy.
3.2.4 Verify the Alert Pipeline
On any data node in the DolphinDB HA cluster, execute the following command multiple times to inject log entries with the ERROR keyword into log file:
writeLogLevel(ERROR,"This is an ERROR message") If configured correctly, Grafana will detect the logs via Promtail → Loki and send an alert email that matches the defined conditions. A successful alert delivery will appear as shown in Figure 3-15.
This confirms that your alert email pipeline is working as expected.

4. Common Alert Rules
Silence Alerts During After-Hours
To avoid unnecessary alerts outside trading hours, go to Notification policies and create a new mute timing entry. As shown in Figure 4-1, define silent periods using the following settings:
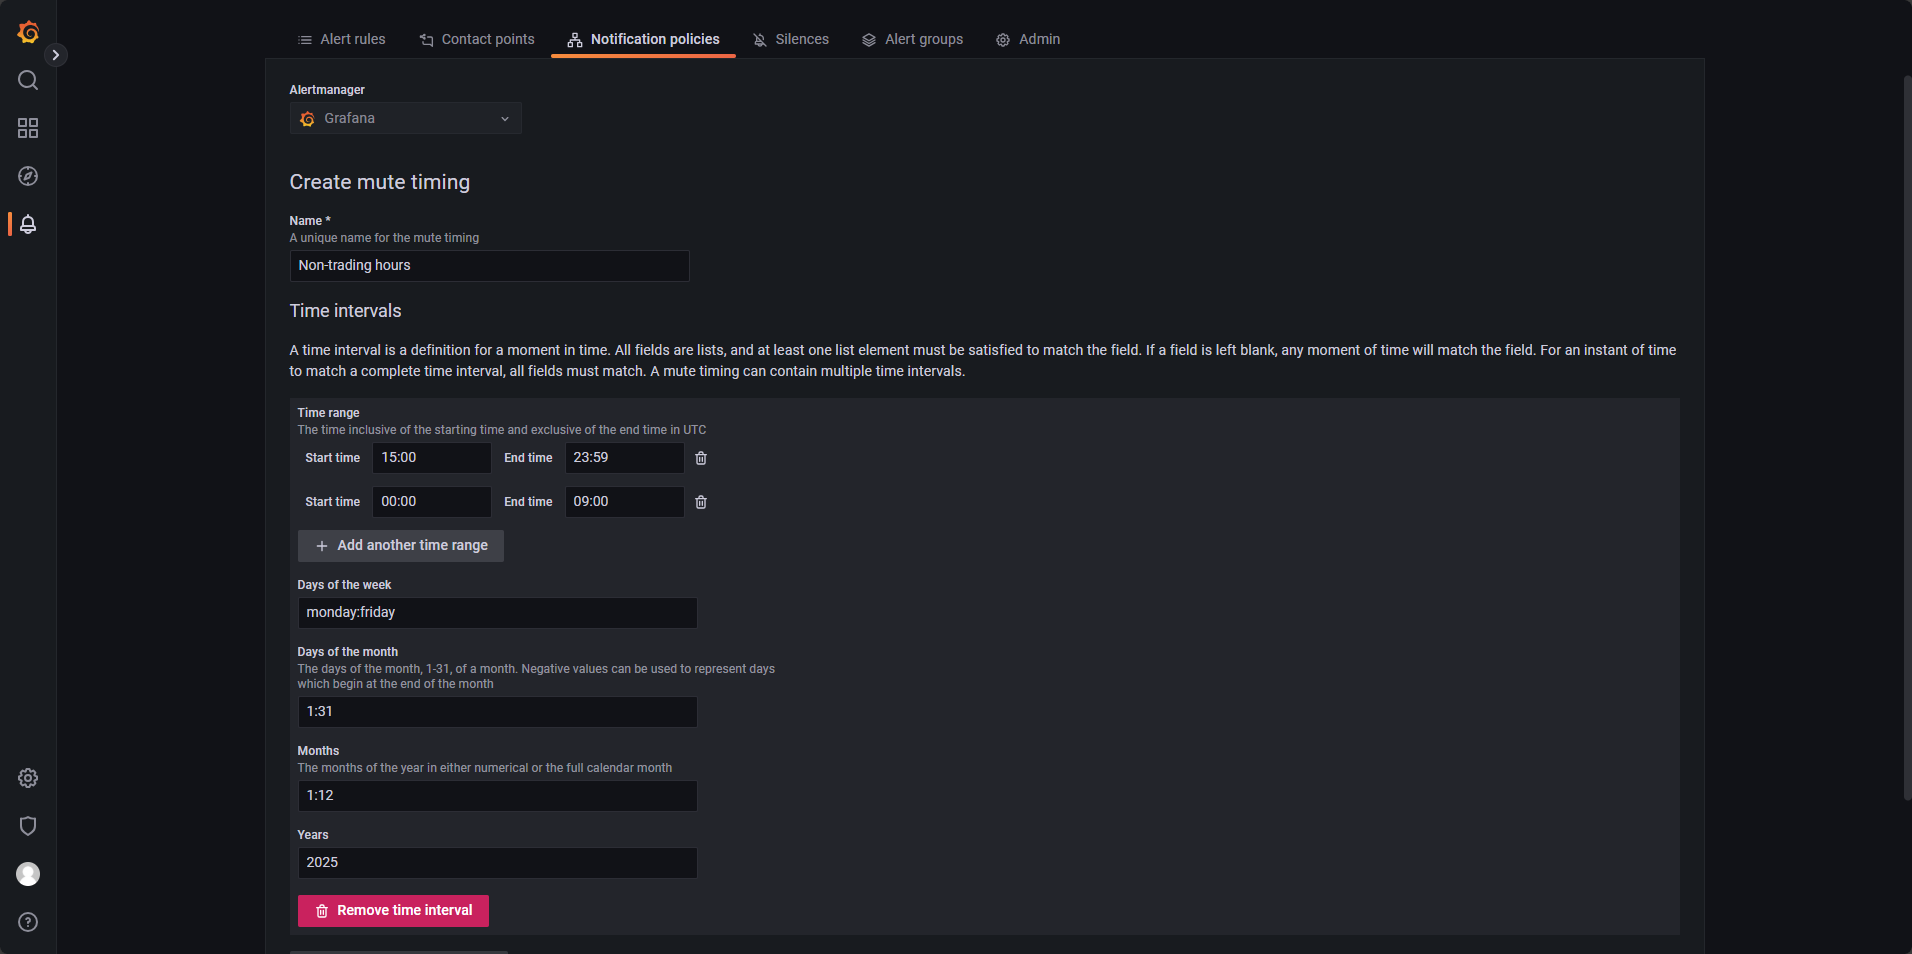
- Time range: Configure multiple entries to cover after-hours. For example, set
00:00–09:00and15:00–23:59. - Days of the week: Set
monday:fridayto cover weekdays. - Days of the month: Set
1:31to include all days. - Month: Set
1:12to include all months. - Years: Set
2025to apply this configuration throughout the year.
Packet Loss Detection for High-Frequency Data Ingestion
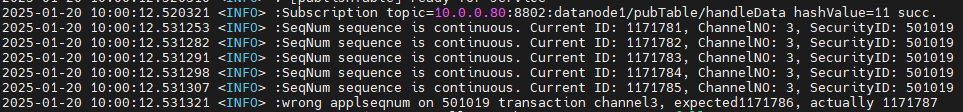
In the SSE (Shanghai Stock Exchange) tick data stream, both stocks and funds share the same channel. Within each channel, OrderIndex and TradeIndex are expected to be continuous. A jump in sequence typically indicates a packet loss.
This can be monitored via changes in the SeqNo field. The Insight plugin already supports logging such events, and additional plugin support is under development.
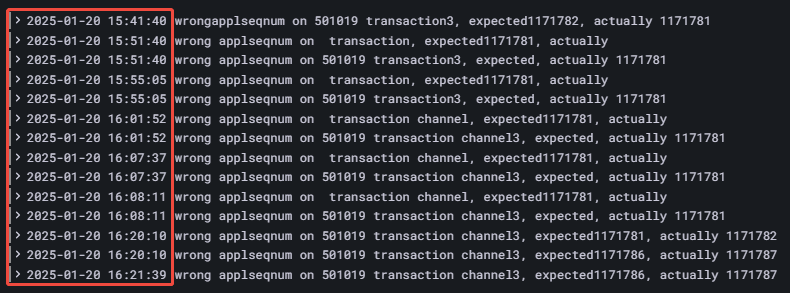
To enable this alert, define a log rule in DolphinDB that outputs an error when a discontinuity is detected, as illustrated in Figure 4-2.
In Alert Rules, configure a LogQL expression to count error logs related to
packet loss over a 5-minute window, with Evaluate every:10s,
For:20s.
count_over_time({job="dolphinDB"} |= "wrong applseqnum" [5m])Monitoring for Missing Stock ID or TradeDate in Real-Time Market Data
If a real-time quote record lacks either the stock ID or TradeDate, this should
trigger an error log using writeLogLevel. Since these issues are
reported with an ERROR level, you can set up a LogQL query to detect ERROR logs from
the corresponding job. As shown in Figure 4-3:

The LogQL query is as follows, with additional parameters set to evaluate every 1
minute for a duration of 2 minutes, with an alert condition defined as WHEN
last() OF A IS ABOVE 0.
count_over_time({job="dolphinDB"} |= "ERROR"[5m])Client Connection Timeout Alert
To catch connection issues, define an alert that triggers when more than five logs containing timeout or connection failed appear within 5 minutes. The configuration is illustrated in Figure 4-4.

Metadata Recovery Log Monitoring
Trigger an alert if recovery failures exceed 10 times within 1 minute, configured as shown in Figure 4-5.

The LogQL query is as follows, with evaluation set to run every 15 seconds over a
30-second window, triggering when last() OF A IS ABOVE 10.
count_over_time({job="dolphinDB"} |~ "(?i)failed to incrementally recover chunk"[1m])Alert on Missing Log Entries
Trigger an alert if no logs are generated by a service within 10 minutes, configured as in Figure 4-6.
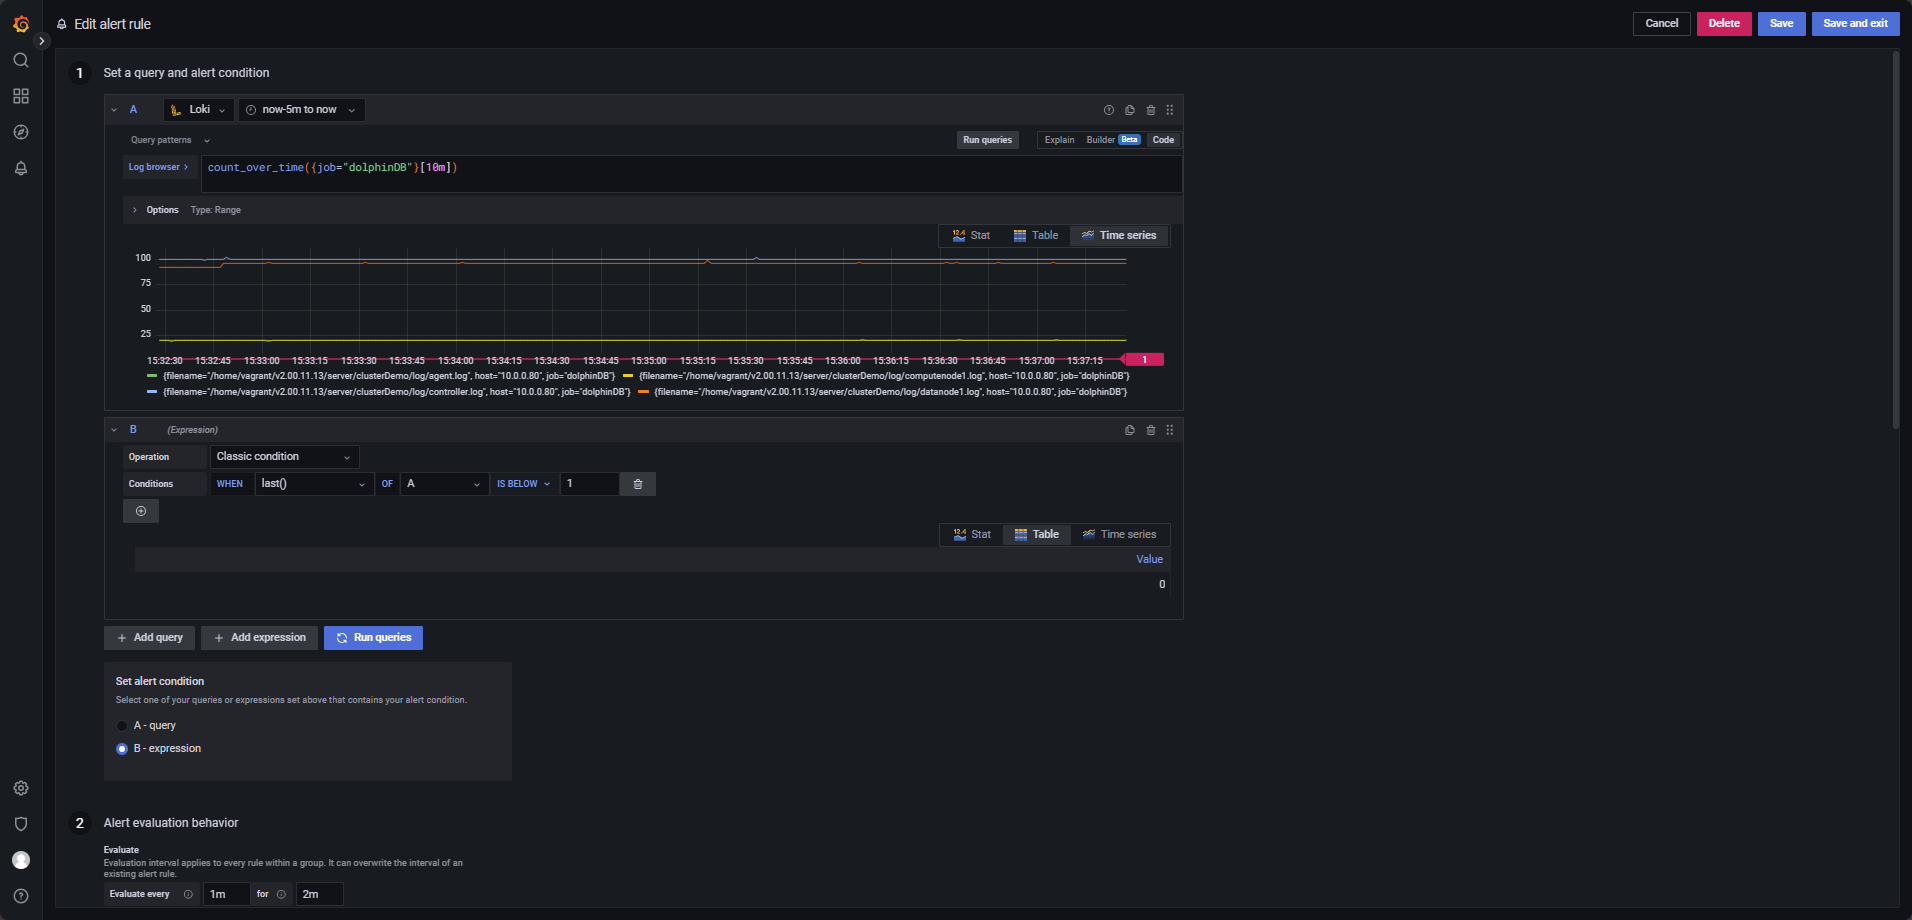
The LogQL query is below, evaluated every 1 minute for 2 minutes, triggering when
last() OF A IS BELOW 1.
Note:
- Ensure the query covers at least the time range from
now-10m to
                        now
. - To monitor specific services, add labels to the query, for example:
count_over_time({filename="/home/vagrant/v2.00.11.13/server/clusterDemo/log/agent.log",job="dolphinDB"}[10m]). This counts log entries for the specified file (agent.log) in the past 10 minutes.
User Login Failure Monitoring
Trigger an alert if a user fails login more than 10 times within 1 hour, configured as in Figure 4-7.
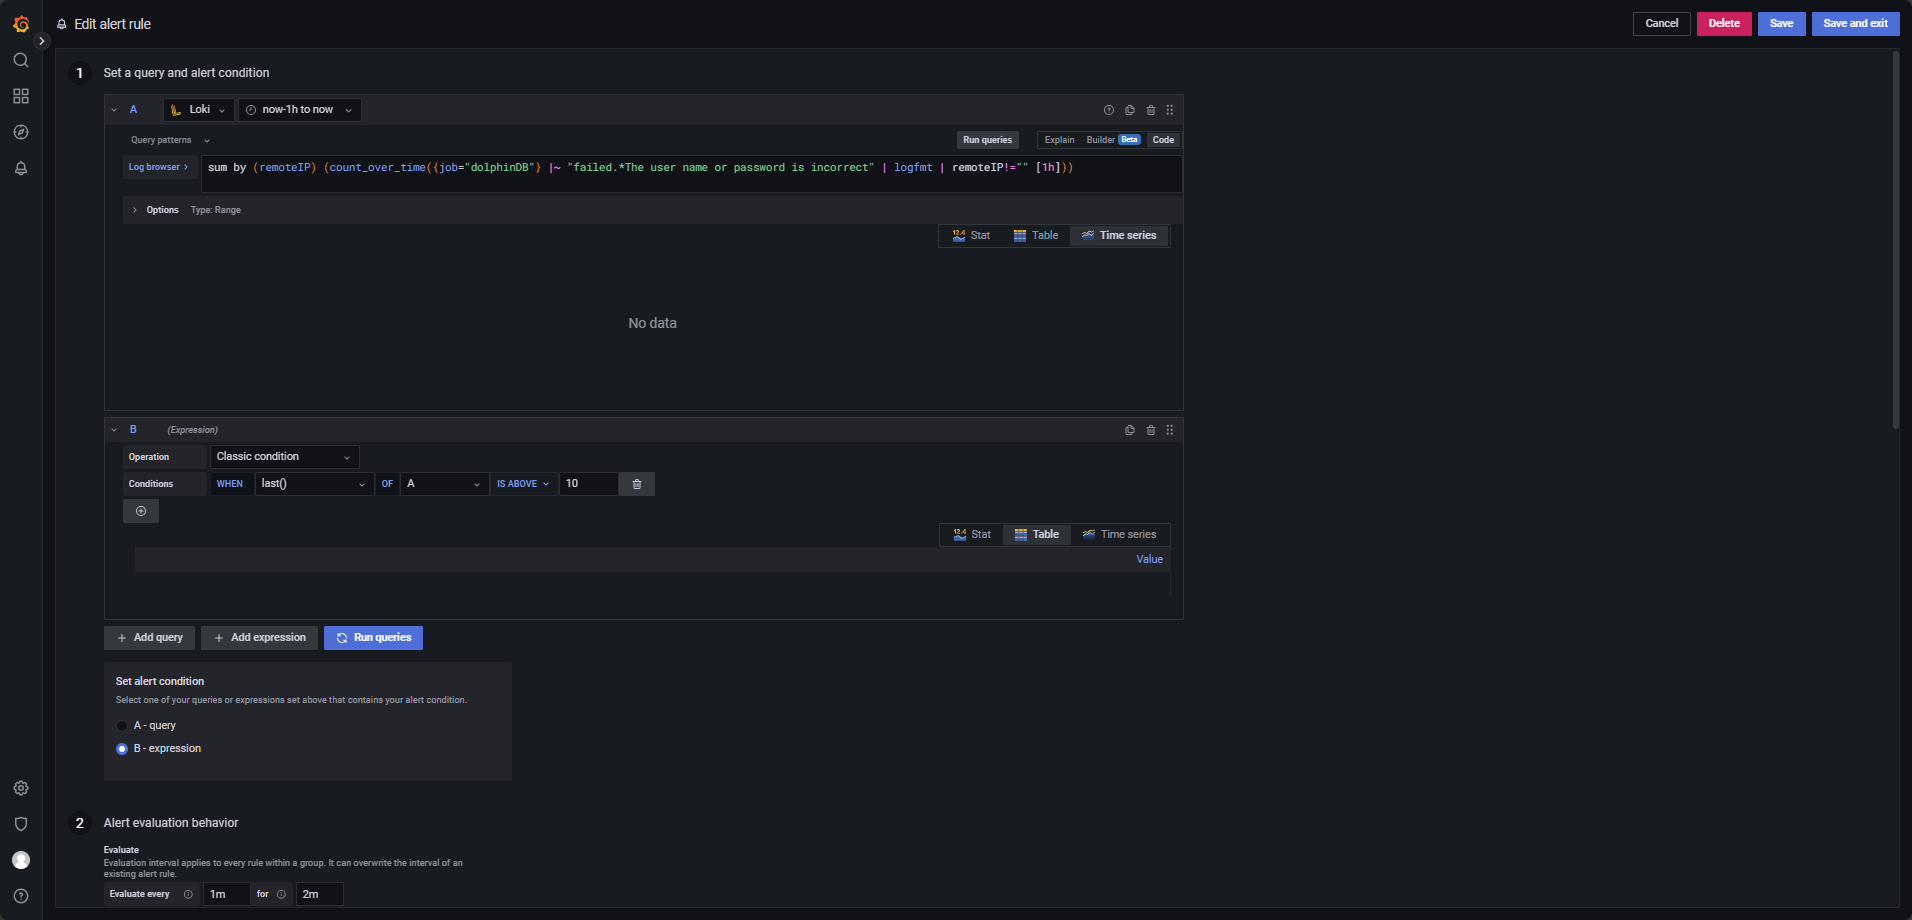
The LogQL query is below:
sum by (remoteIP) (count_over_time({job="dolphinDB"} |~ "failed.*The user name or password is incorrect" | logfmt | remoteIP!="" [1h]))This query counts login failures grouped by IP (remoteIP) and triggers alerts only
when a specific IP exceeds the threshold. Adjust the query time range to cover at
least now-1h to now.
This query is evaluated every 1 minute for 2 minutes, with the alert condition
last() OF A IS ABOVE 10.
Out of Memory Log Monitoring
Trigger an alert if more than 2 "Out of memory" errors occur within 5 minutes, configured as in Figure 4-8.
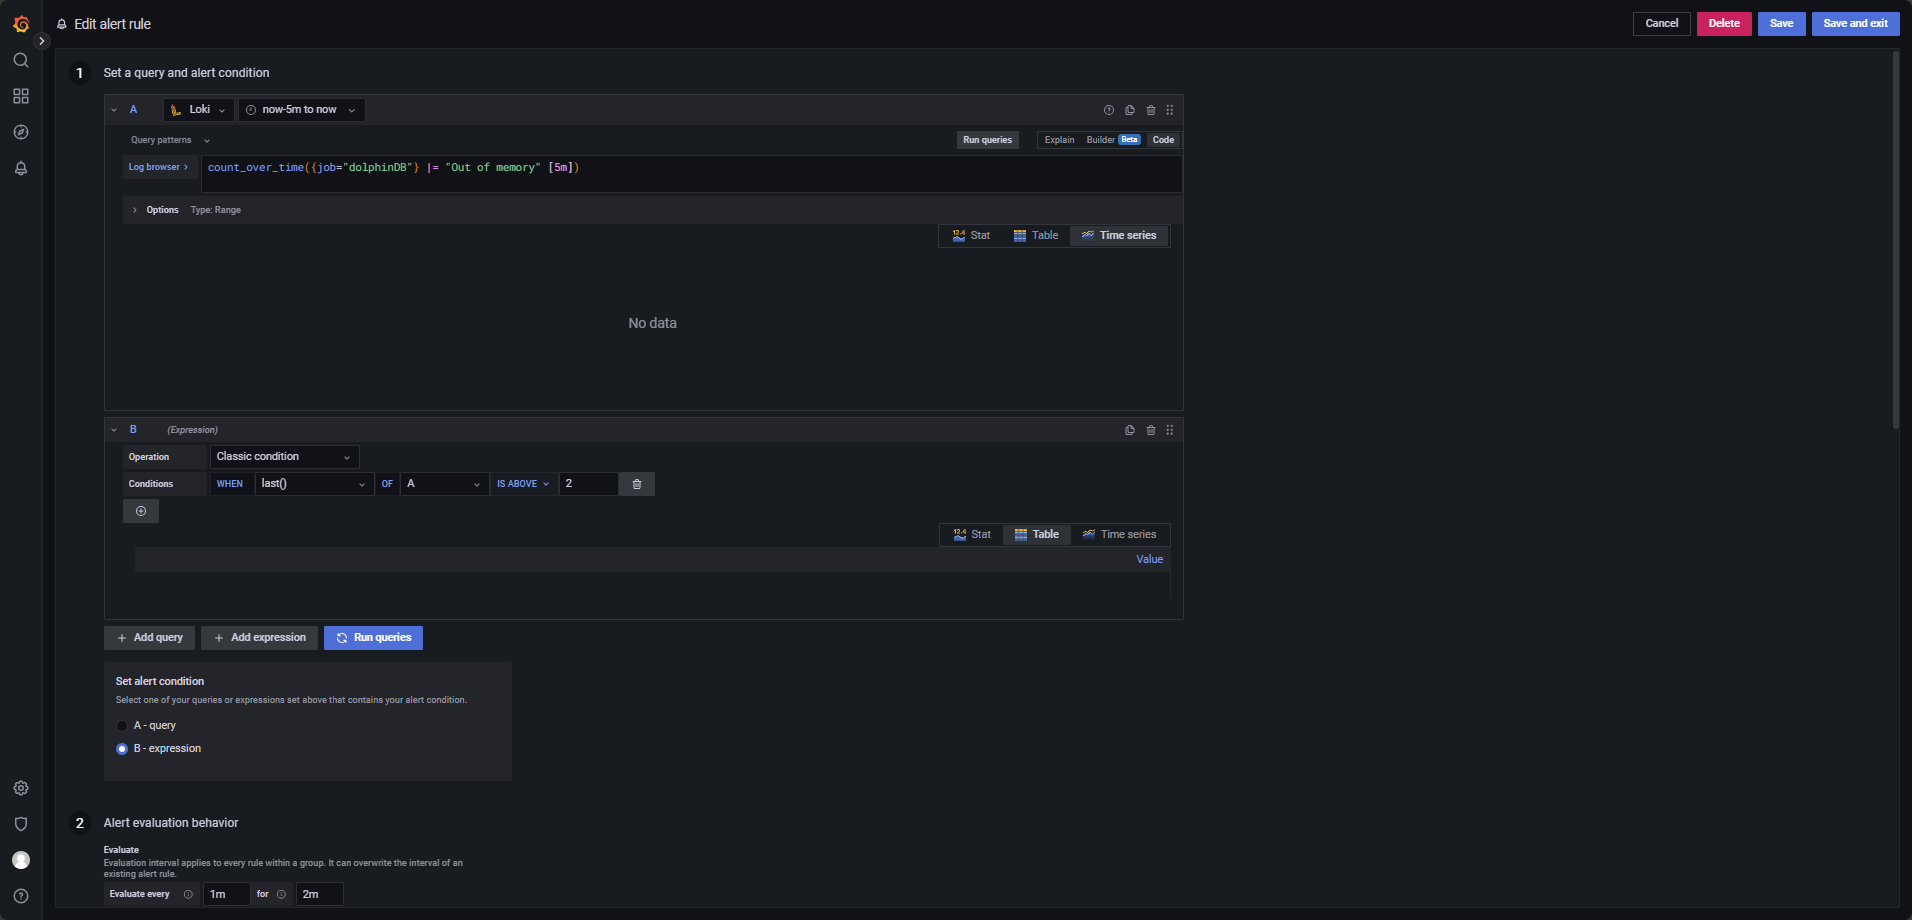
The LogQL query is evaluated every 1 minute for 2 minutes and triggers when
last() OF A IS ABOVE 2.
count_over_time({job="dolphinDB"} |= "Out of memory" [5m])Core Dump Monitoring
Trigger an alert when a core dump file is generated.
The core_file_monitor job defined in the Promtail configuration
(promtail.yaml) is specifically used to monitor the generation of core dump files,
as shown in Figure 4-9.
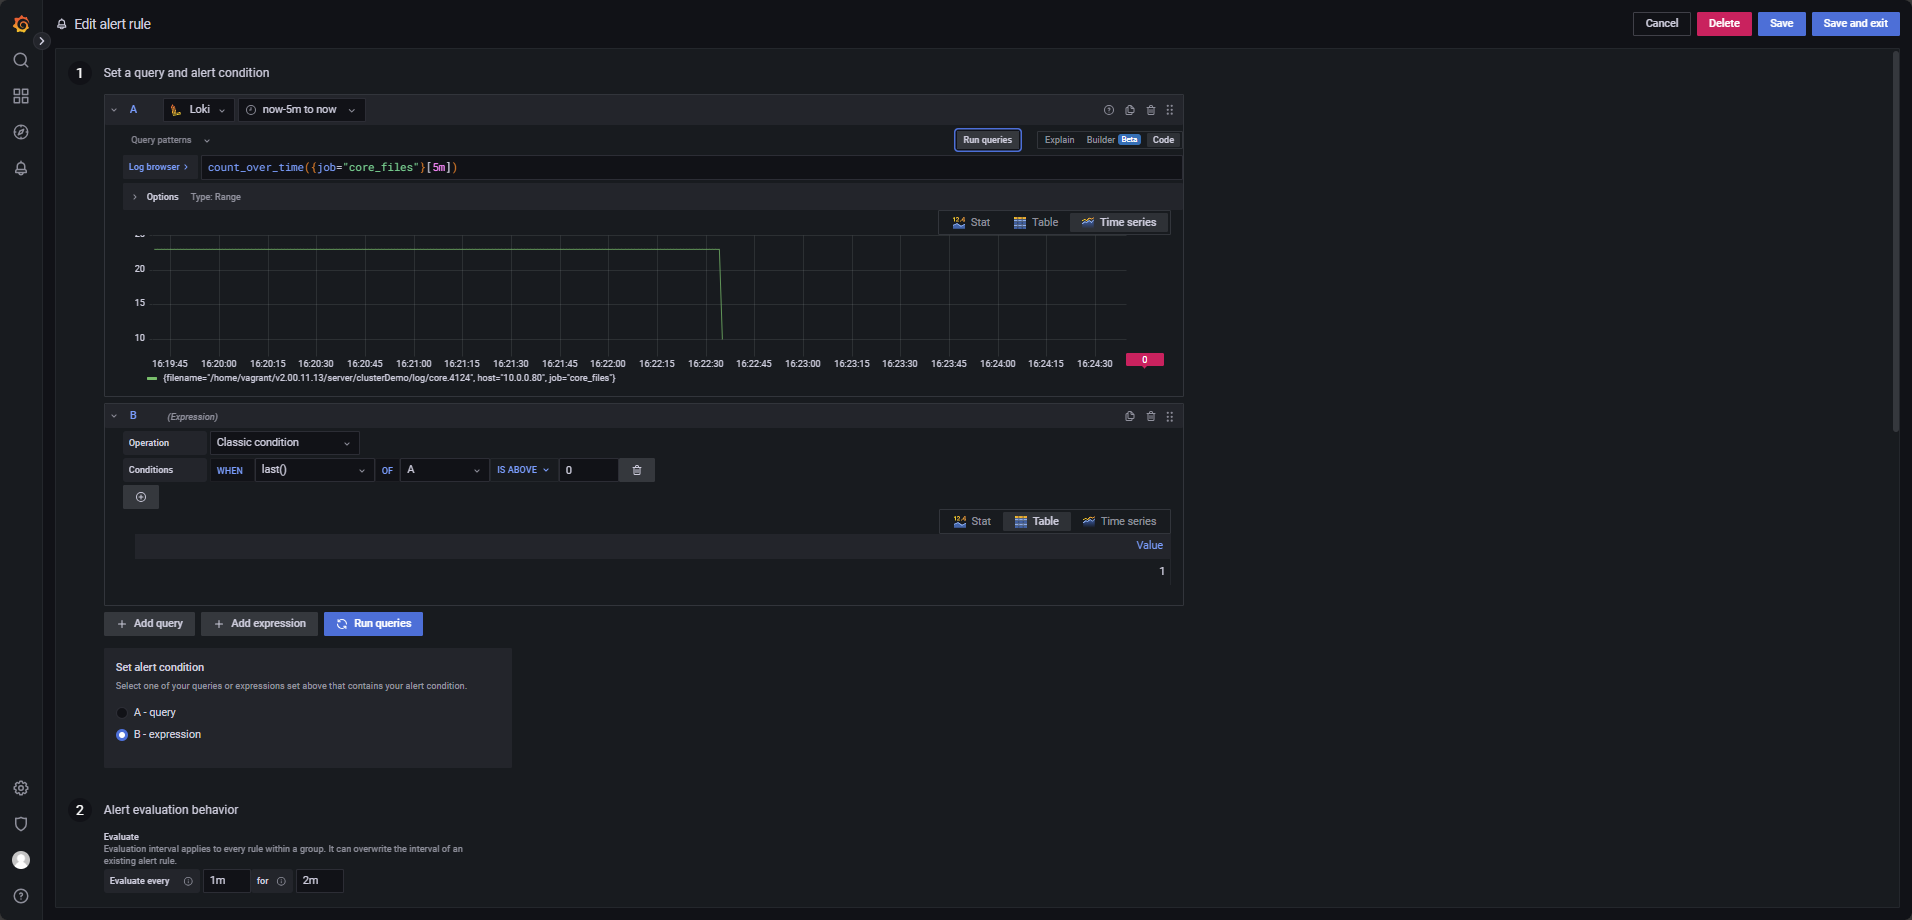
Use the following LogQL expression, with alert evaluation every 1 minute over a
2-minute period, and the condition set to WHEN last() OF A IS ABOVE
0.
count_over_time({job="core_files"}[5m])Shutdown Detection
Trigger an alert when a node goes offline.
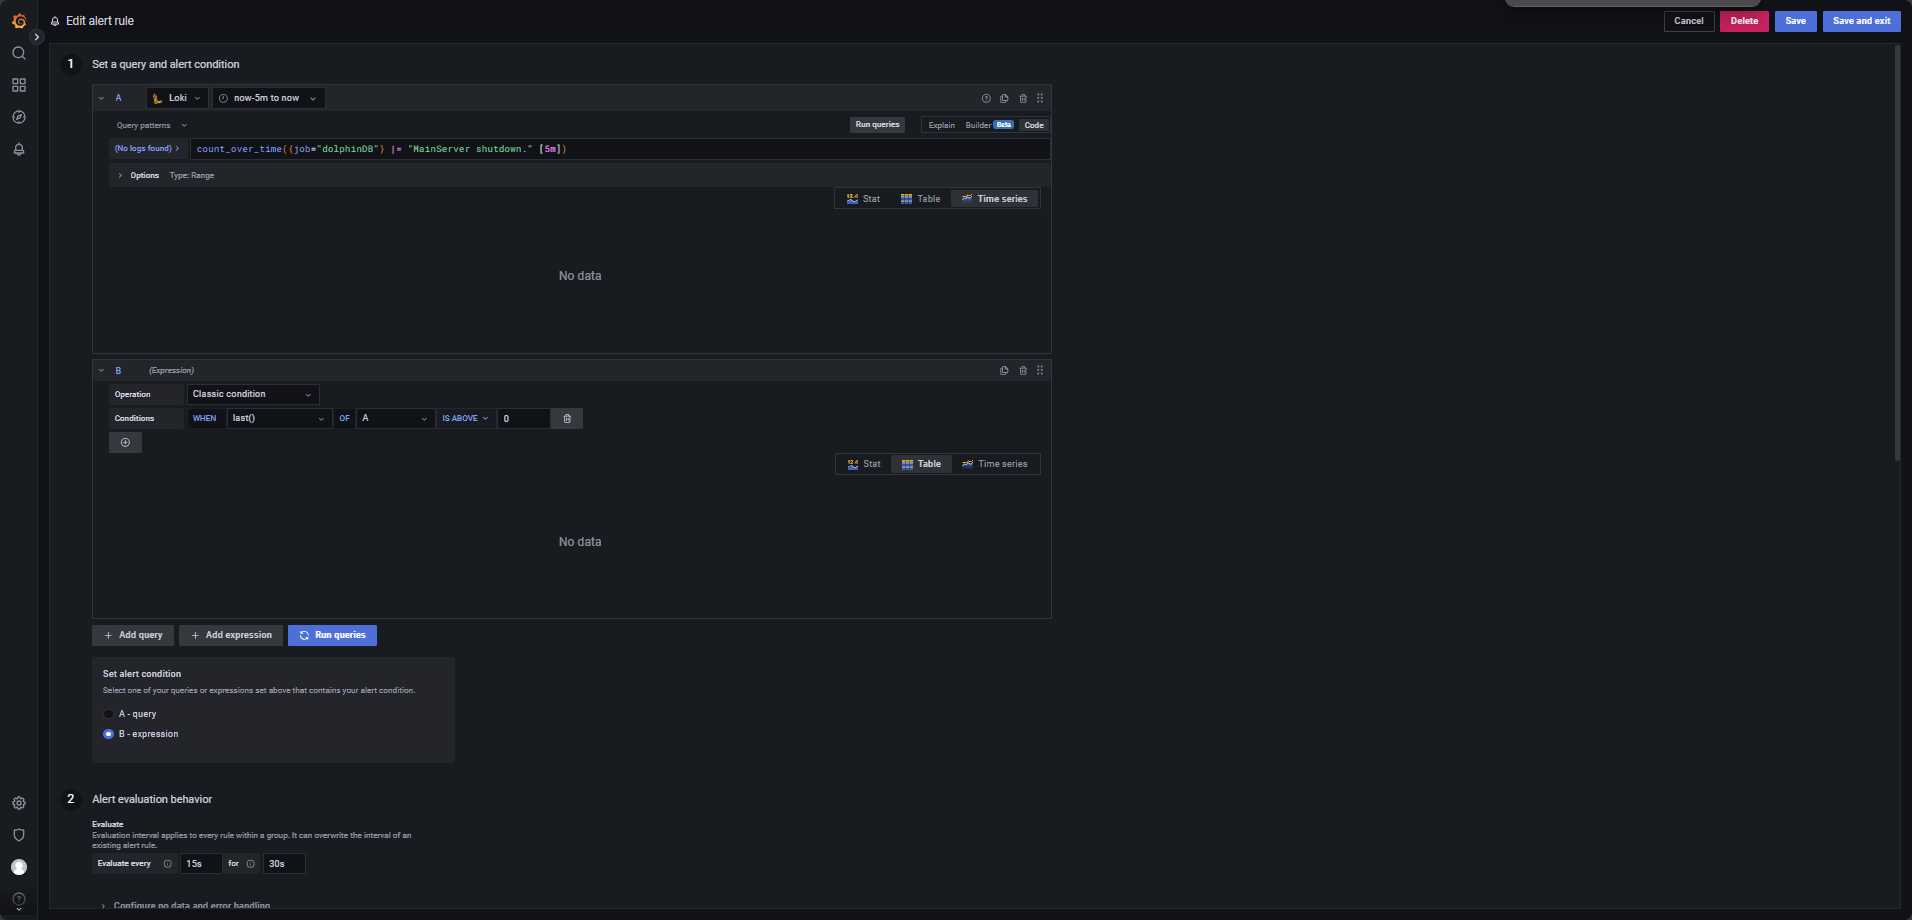
Use the following LogQL query, with evaluations every 15 seconds for a 30-second
window, and trigger condition WHEN last() OF A IS ABOVE 0, as shown
in Figure 4-10.
Low Disk Space Monitoring
Trigger an alert when the system detects insufficient disk space.
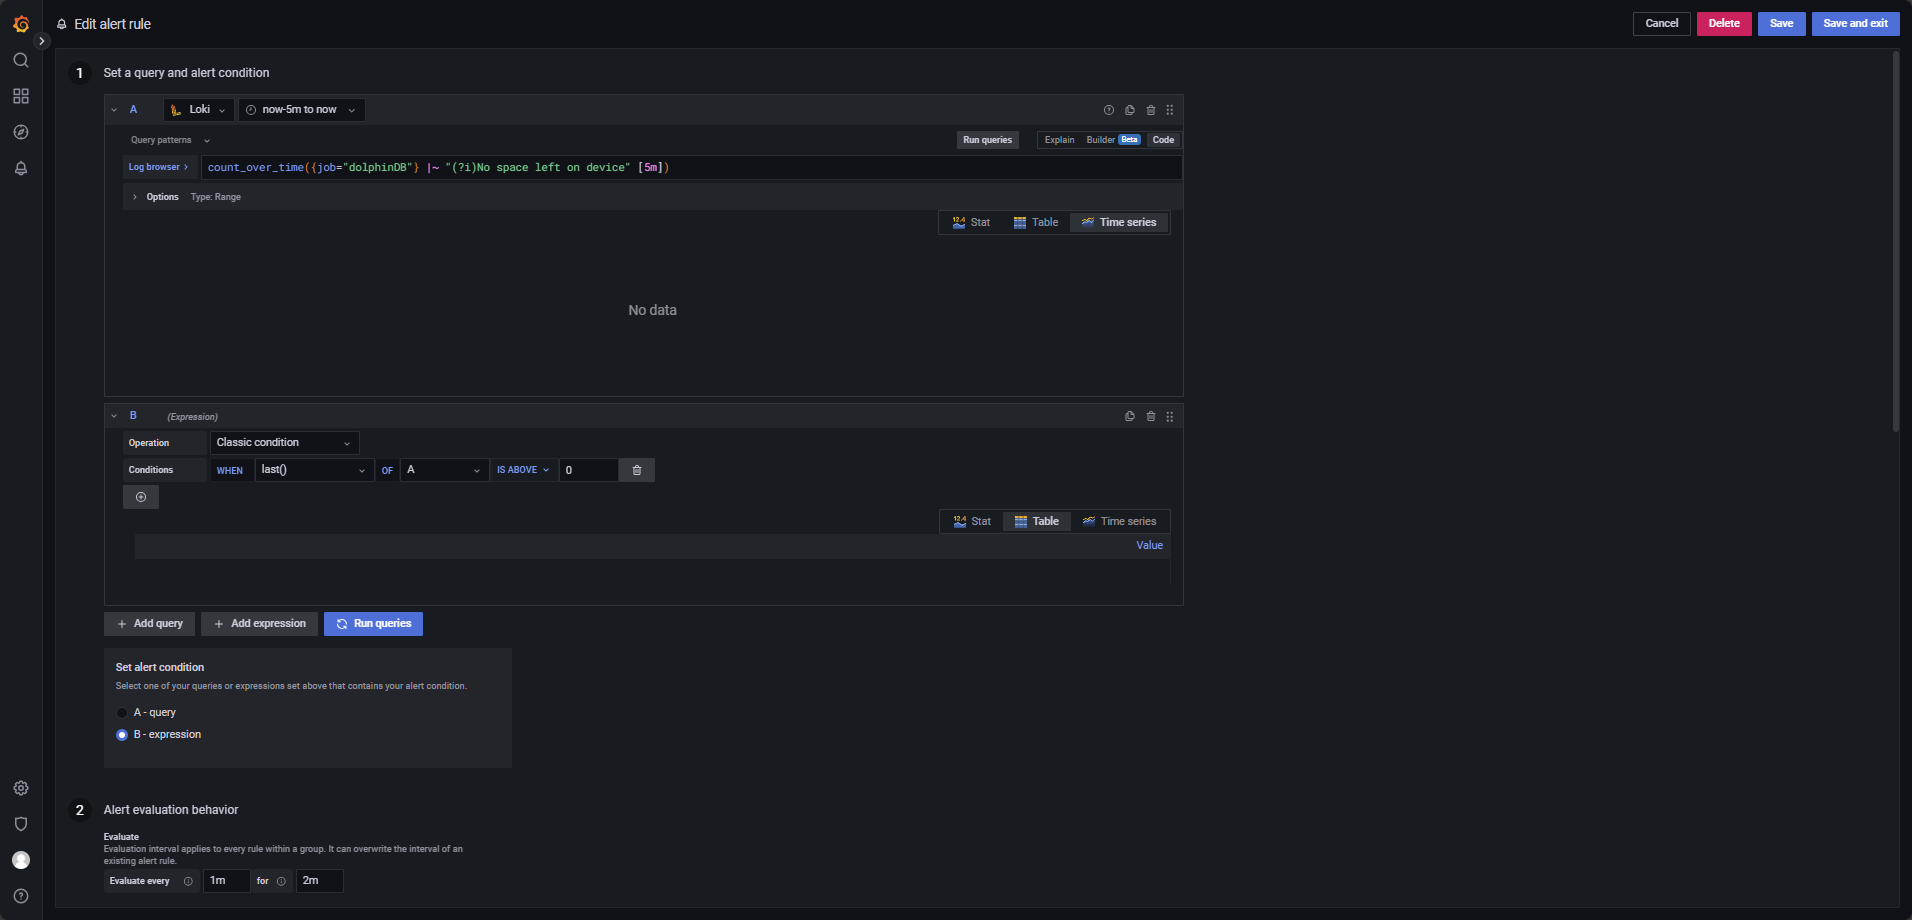
Use the LogQL expression below, evaluated every 1 minute for 2 minutes, triggering
when last() OF A IS ABOVE 0, as shown in Figure 4-11.
count_over_time({job="dolphinDB"} |~ "(?i)No space left on device" [5m])Frequent Node Join/Leave or Network Instability Alert
Trigger an alert when a node frequently disconnects and reconnects—specifically, if more than 10 transitions occur within 3 minutes.
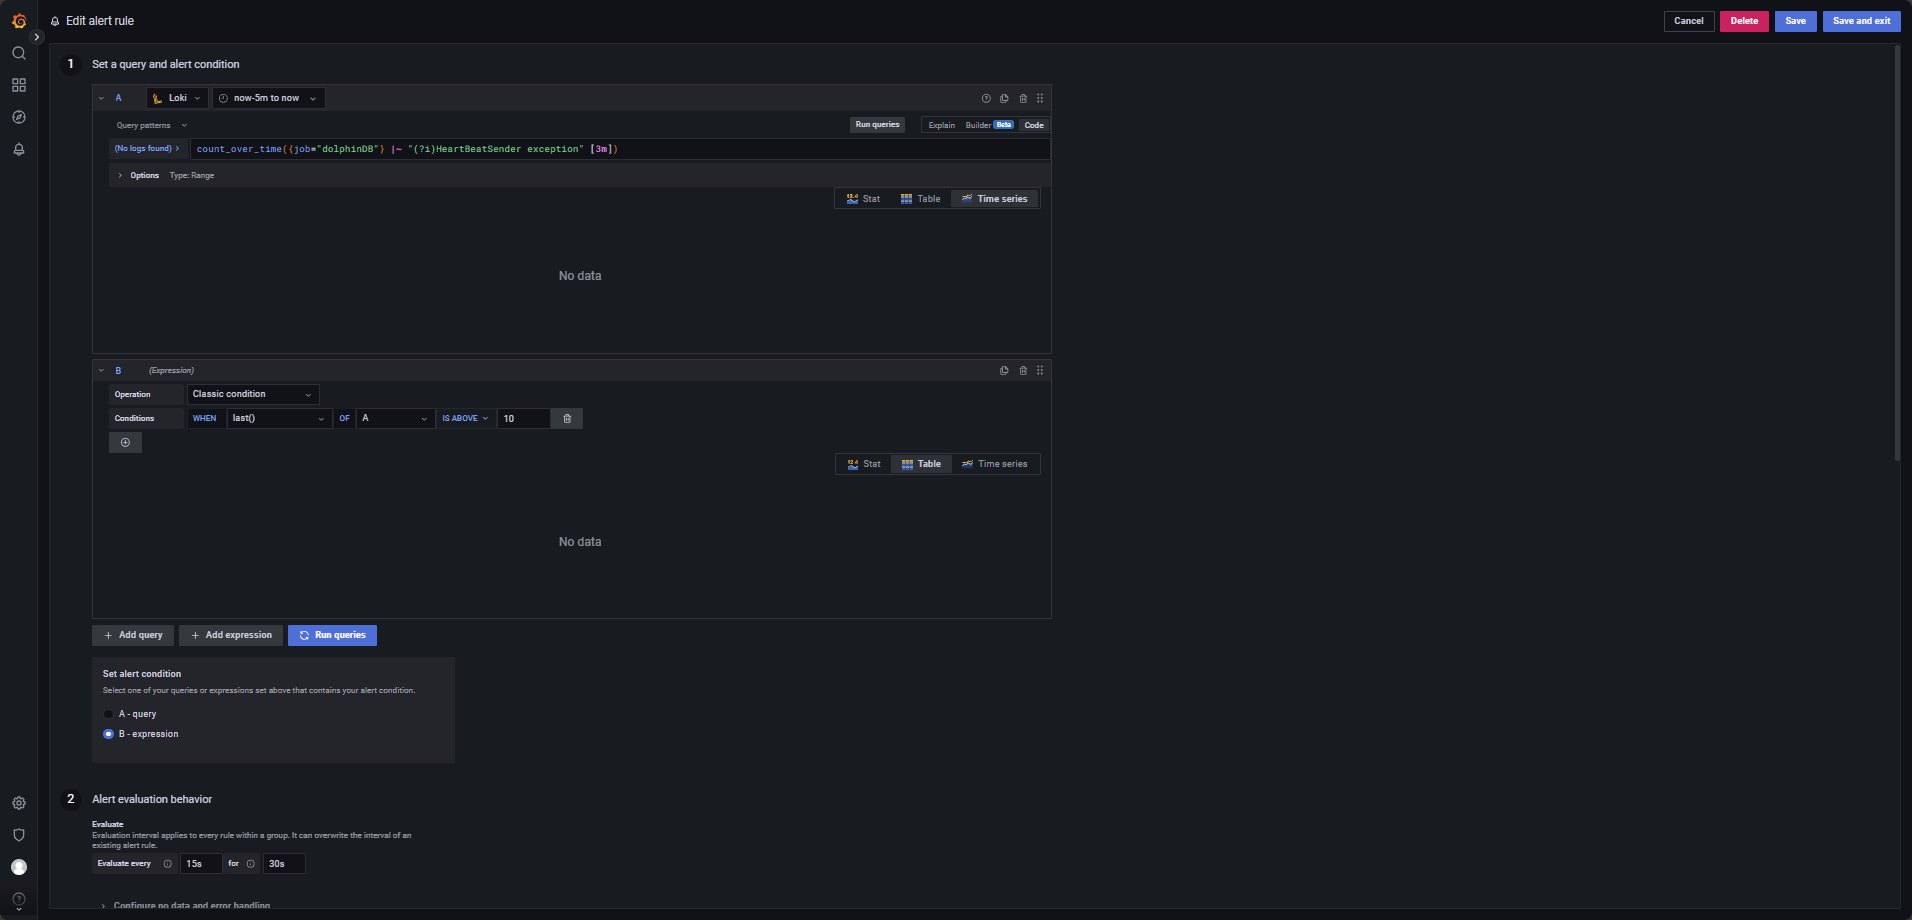
Use the following LogQL query, with evaluation every 15 seconds for a 30-second
duration, and alert condition WHEN last() OF A IS ABOVE 10, as
shown in Figure 4-12.
count_over_time({job="dolphinDB"} |~ "(?i)HeartBeatSender exception" [3m])5. FAQ
Promtail Timestamp Parsing Behavior
In the Loki and Promtail log monitoring architecture, if Promtail does not explicitly parse timestamps from log entries, Loki will use the ingestion time (i.e., the time the log is pushed to Loki) as the timestamp. To preserve original log timestamps, you must configure "promtail.yaml" accordingly:
server:
  http_listen_port: 9080
  grpc_listen_port: 0

positions:
  filename: ./positions.yaml

clients:
  - url: http://10.0.0.80:3100/loki/api/v1/push  # Loki server endpoint

scrape_configs:
  - job_name: dolphinDB
    static_configs:
      - targets:
          - 10.0.0.80
        labels:
          job: dolphinDB
          host: 10.0.0.80
          __path__: /home/vagrant/v2.00.11.13/server/clusterDemo/log/*.log
    pipeline_stages:
      # Extract timestamp, log level, and message using regex
      - regex:
          expression: '^(?P<ts>\d{4}-\d{2}-\d{2}\s\d{2}:\d{2}:\d{2}\.\d+)\s(?P<level><\w+>)\s:(?P<message>.*)$'
      # Parse the extracted timestamp into standard format
      - timestamp:
          source: ts
          format: 2006-01-02 15:04:05.000000  # Go-style layout
          timezone: "China/Beijing"
      # Attach the log level as a label
      - labels:
          level:
      # Use the extracted message as the log output
      - output:
          source: message
After applying this configuration and restarting Promtail and Loki, you may encounter a "timestamp too old" error (see Figure 5-1).
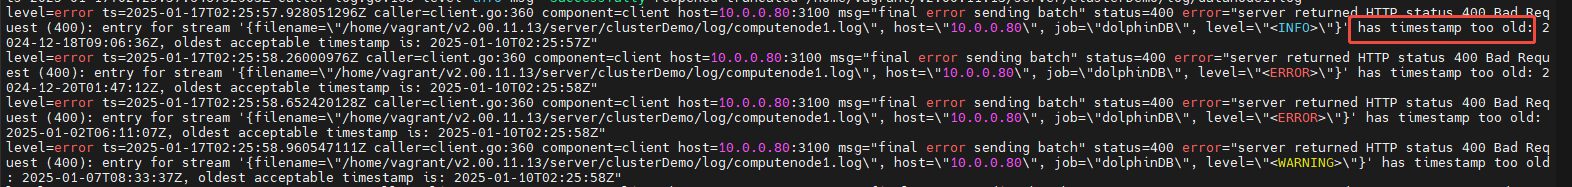
This occurs because Promtail now uses the timestamp extracted from the log itself, and if the log is too old, Loki will reject it.
To resolve this, increase the reject_old_samples_max_age in Loki’s
"limits_config" section:
limits_config:
  enforce_metric_name: false
  reject_old_samples: true
  reject_old_samples_max_age: 1680h  # Increase max allowed age for logs
  ingestion_rate_mb: 1024
  ingestion_burst_size_mb: 2048
After restarting Grafana, you'll find that Loki can now filter logs using the level label (see Figure 5-2). Additionally, log entries display only a single timestamp (see Figure 5-3), indicating that the original timestamps extracted from the logs have been successfully parsed and applied. This confirms that the timestamp parsing configuration is working correctly, and Loki no longer attaches its own ingestion time.
Note: Once the level field is extracted as a label, it must be queried using
label matchers instead of plain text searches. For instance, replace
count_over_time({job="dolphinDB"} |= "ERROR"[5m]) with
count_over_time({job="dolphinDB", level="ERROR"}[5m]). Be sure
to update your alert rules accordingly.
Minimizing Alert Evaluation Delay
To improve alert responsiveness, reduce the evaluation interval and the alerting hold
time (evaluation window). The configuration shown in Figure 5-4 sets the minimum
recommended values, with Evaluate every: 10s (check every 10
seconds) and For: 20s (evaluate over 20 seconds before firing).

Note: The "For" duration must be at least twice the "Evaluate every"
interval.For example, if Evaluate every = 1m, then "For" must be at
least 2m.
6. Summary
In high-availability deployments of the distributed time-series database DolphinDB, log monitoring plays a vital role in ensuring system reliability and accelerating issue diagnosis. This document introduces a lightweight, efficient, and scalable logging solution built on Loki, Promtail, and Grafana, delivering a robust and cost-effective framework for log collection, analysis, and visualization tailored to DolphinDB’s operational needs.
7. Appendix
- Promtail Linux amd64 installation package and configuration file:
- Loki Linux amd64 installation package and configuration file: