mpercentileTopN
Syntax
mpercentileTopN(X, S, percent, window, top, [interpolation], [ascending],
                    [tiesMethod='oldest'])
Please see mTopN for the parameters and windowing logic.
Details
-
When X is a vector, within a sliding window of given length (measured by the number of elements), the function stably sorts X by S in the order specified by ascending, then calculates the moving percentile rank of the first top elements.
-
When X is a matrix or table, conduct the aforementioned calculation within each column of X. The result is a matrix/table with the same shape as X.
Parameters
X is a numeric vector, matrix or table.
S is a numeric/temporal vector, matrix or table, based on which X are sorted.
percent is an integer or floating value between 0 and 100.
interpolation (optional) is a string indicating the interpolation method to use if the specified percentile is between two elements in X (assuming the ith and (i+1)th element in the sorted X) . It can take the following values:
-
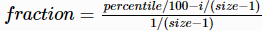
'linear' (default): Return Xi + (Xi+1 - Xi)* fraction, where
-
'lower': Return Xi
-
'higher': Return Xi+1
-
'nearest': Return Xi+1 or Xi that is closest to the specified percentile
-
'midpoint': Return (Xi+1 + Xi)/2
Returns
-
Returns a vector of the same length as the input when the input is a vector.
-
Returns a matrix with the same dimensions as the input when the input is a matrix.
-
Returns a table with the same schema as the input when the input is a table.
-
Returns a tuple with the corresponding structure when the input is a tuple.
Examples
Using IBM stock as an example, simulate trading prices and volumes for six consecutive trading days:
symbol = take(`IBM, 6)
tradeDate = 2024.01.02 2024.01.03 2024.01.04 2024.01.05 2024.01.08 2024.01.09
tradePrice = [182.5, 183.8, 181.2, 184.6, 183.1, 185.0]
tradeVolume = [520, 860, 610, 940, 650, 880]

stockDaily = table(symbol, tradeDate, tradePrice, tradeVolume)
stockDaily;
Output:
| symbol | tradeDate | tradePrice | tradeVolume |
|---|---|---|---|
| IBM | 2024.01.02 | 182.5 | 520 |
| IBM | 2024.01.03 | 183.8 | 860 |
| IBM | 2024.01.04 | 181.2 | 610 |
| IBM | 2024.01.05 | 184.6 | 940 |
| IBM | 2024.01.08 | 183.1 | 650 |
| IBM | 2024.01.09 | 185 | 880 |
Example 1: Over the most recent four trading days, select the top two trading days by trading volume and calculate the 50th percentile of trading prices for each window:
mpercentileTopN(X=tradePrice, S=tradeVolume, percent=50, window=4, top=2, ascending=false)
// Output: [182.5, 183.15, 182.5, 184.2, 184.2, 184.8]-
For the data on 2024.01.09, within the most recent four-day window:
- tradePrice=[181.2, 184.6, 183.1, 185.0]
- tradeVolume=[610, 940, 650, 880]
- Because ascending=false, trading volumes are sorted in descending order, and the top two trading days by trading volume are selected. Their corresponding trading prices are 184.6 and 185.0; The 50th percentile of these two prices is 184.8.
Example 2: Set interpolation to determine how the value is chosen when the quantile falls between two observations.
Using the same trading prices and volumes, over the most recent four trade days, select the bottom two trading days by trading volume and calculate the 20th percentile of trading prices for each window:
mpercentileTopN(X=tradePrice, S=tradeVolume, percent=20, window=4, top=2, interpolation="lower")
// Output: [182.5, 182.5, 181.2, 181.2, 181.2, 181.2]
mpercentileTopN(X=tradePrice, S=tradeVolume, percent=20, window=4, top=2, interpolation="higher")
// Output: [182.5, 183.8, 182.5, 182.5, 183.1, 183.1]
mpercentileTopN(X=tradePrice, S=tradeVolume, percent=20, window=4, top=2, interpolation="nearest")
// Output: [182.5, 182.5, 181.2, 181.2, 181.2, 181.2]
mpercentileTopN(X=tradePrice, S=tradeVolume, percent=20, window=4, top=2, interpolation="midpoint")
// Output: [182.5, 183.15, 181.85, 181.85, 182.15, 182.15]
mpercentileTopN(X=tradePrice, S=tradeVolume, percent=20, window=4, top=2, interpolation="linear")
// Output: [182.5, 182.76, 181.46, 181.46, 181.58, 181.58]Using the data on 2024.01.09 as an example, with the default ascending order, the bottom two trading days by trading volume are selected, and their corresponding trading prices are 181.2 and 183.1:
- interpolation="lower": Takes the lower price, 181.2;
- interpolation="higher": Takes the higher price, 183.1;
- interpolation="nearest": Takes the price nearest to the quantile, 181.2;
- interpolation="midpoint": Takes the midpoint of the two values, 182.15;
- interpolation="linear": Uses linear interpolation based on position, substituting the data into Xi + ( Xi+1 - Xi ) * fraction to calculate 181.2 + (183.1 - 181.2) * 0.2 = 181.58.
Example 3: Set tiesMethod to determine how samples are selected when there are ties at the cutoff.
The following code simulates data for NVDA stock:
symbol = take(`NVDA, 6)
tradeDate = 2024.02.01 2024.02.02 2024.02.05 2024.02.06 2024.02.07 2024.02.08
tradePrice = [431.2, 433.5, 432.1, 434.8, 433.0, 435.2]
tradeVolume = [700, 900, 900, 900, 760, 900]

tieCase = table(symbol, tradeDate, tradePrice, tradeVolume)
tieCase;
Output:
| symbol | tradeDate | tradePrice | tradeVolume |
|---|---|---|---|
| NVDA | 2024.02.01 | 431.2 | 700 |
| NVDA | 2024.02.02 | 433.5 | 900 |
| NVDA | 2024.02.05 | 432.1 | 900 |
| NVDA | 2024.02.06 | 434.8 | 900 |
| NVDA | 2024.02.07 | 433.0 | 760 |
| NVDA | 2024.02.08 | 435.2 | 900 |
Over the most recent five trading days, select the top two trading days by trading volume, calculate the 50th percentile of trading prices for each window, and specify different tiesMethod values:
mpercentileTopN(X=tradePrice, S=tradeVolume, percent=50, window=5, top=2, ascending=false, tiesMethod="oldest")
// Output: [431.2, 432.35, 432.8, 432.8, 432.8, 432.8]

mpercentileTopN(X=tradePrice, S=tradeVolume, percent=50, window=5, top=2, ascending=false, tiesMethod="latest")
// Output: [431.2, 432.35, 432.8, 433.45, 433.45, 435.0]

mpercentileTopN(X=tradePrice, S=tradeVolume, percent=50, window=5, top=2, ascending=false, tiesMethod="all")
// Output: [431.2, 432.35, 432.8, 433.5, 433.5, 434.15]
Using the data on 2024.02.08 as an example, tradeVolume=[900, 900, 900, 760, 900] in the most recent five-day window. Four trading days are tied for the highest trading volume of 900, but top=2 requires that only the top two ranks be retained:
- tiesMethod="oldest": Takes the two highest-volume trading days that entered the window earliest, with corresponding prices of 433.5 and 432.1;
- tiesMethod="latest": Takes the two highest-volume trading days that entered the window latest, with corresponding prices of 434.8 and 435.2;
- tiesMethod="all": Retains all trading days tied for the highest trading volume, with corresponding prices of 433.5, 432.1, 434.8, and 435.2.