SQL Trace
SQL Trace is a set of functional tools provided by DolphinDB. It allows users to analyze the internal execution time of complex SQL queries by tracing the step-by-step execution process of SQL scripts. This capability helps users identify performance bottlenecks and optimize query efficiency.
The setTraceMode function is used to enable or disable SQL tracing. A
complete tracing process must start with setTraceMode(true) and end
with setTraceMode(false). Note that DolphinDB begins tracing from the
first request received after enabling tracing. Therefore, the
setTraceMode command must be executed separately from the
statements to be traced.
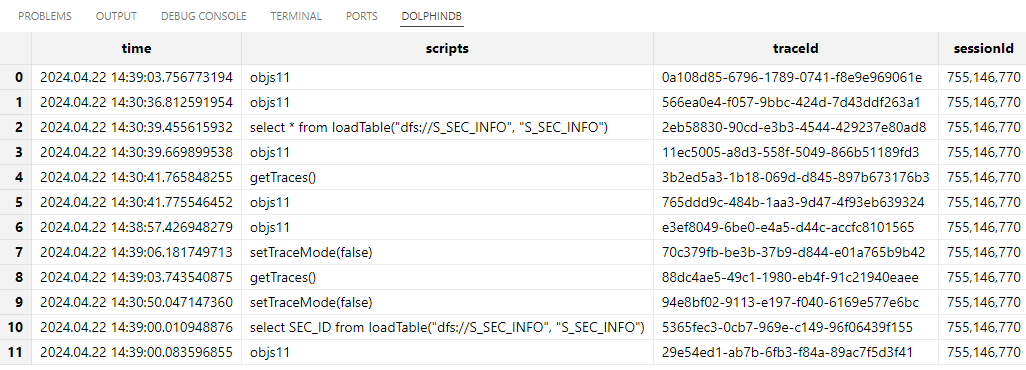
After enabling tracing, you can call getTraces to retrieve a table
containing trace information. This table records the timestamps when the client sends
the script to the server, the scripts sent to the server for execution, the trace IDs,
and the ID of the sessions that initiates the tracing.
For example, the following script demonstrates a complete tracing process:
setTraceMode(true)
go
select * from loadTable("dfs://S_SEC_INFO", "S_SEC_INFO")
setTraceMode(false)
The getTraces() function is used to obtain the trace information. The
result is show in the following figure.
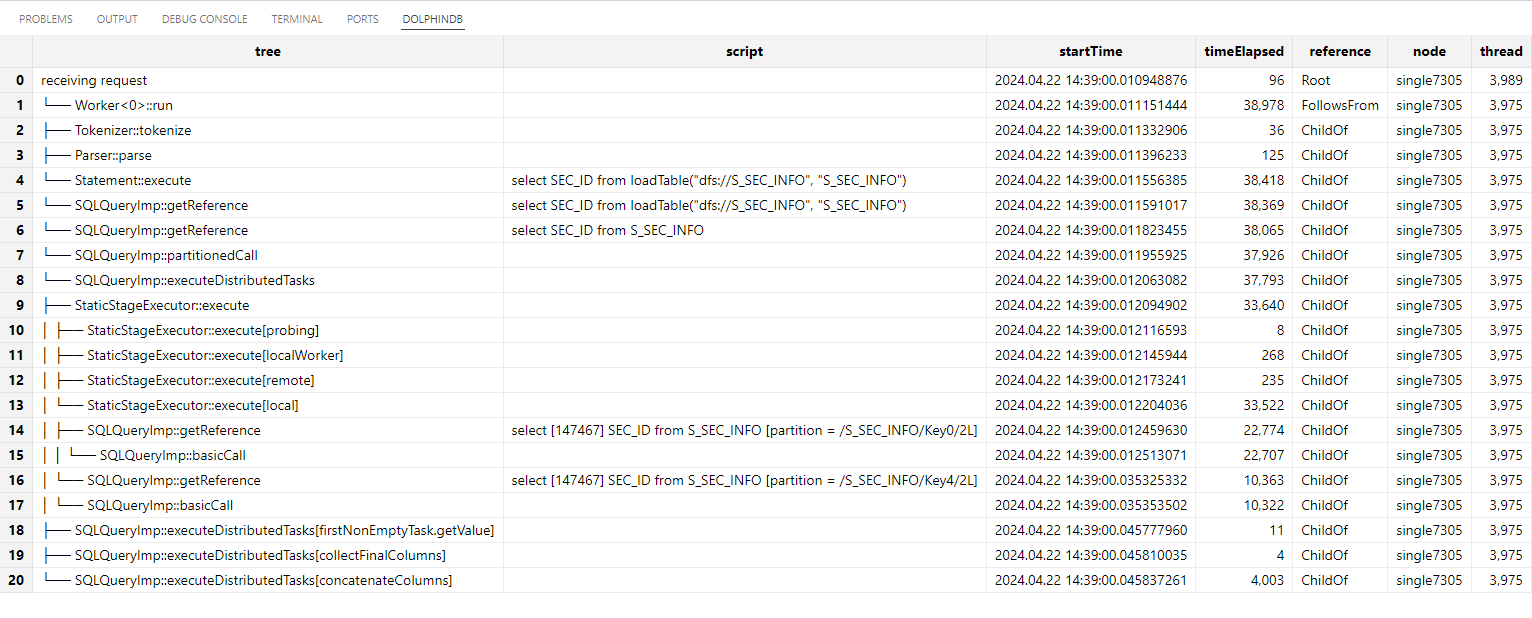
viewTraceInfo(traceId, [isTreeView = true]) function is used to
display the trace details for a specific trace ID. For example, to view the trace
details for the SQL statement executed above, you can use the following
command:viewTraceInfo("2eb58830-90cd-e3b3-4544-429237e80ad8")The following figure presents the SQL execution process in a tree structure and details
the execution time for each step.