plotHist
Syntax
plotHist(data, [binNum], [range], [title])
Arguments
data is a vector, or a matrix column, or a table column.
binNum is the number of bins the histogram shows.
range is the data range in the histogram.
title is graph title.
Details
Generate a histogram chart object.
Examples
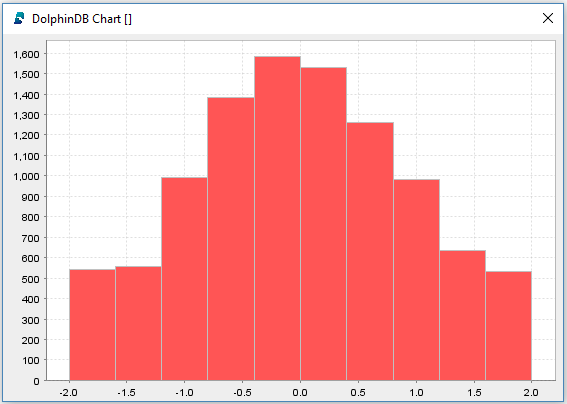
x=norm(0.0, 1.0, 10000);
plotHist(x, 10)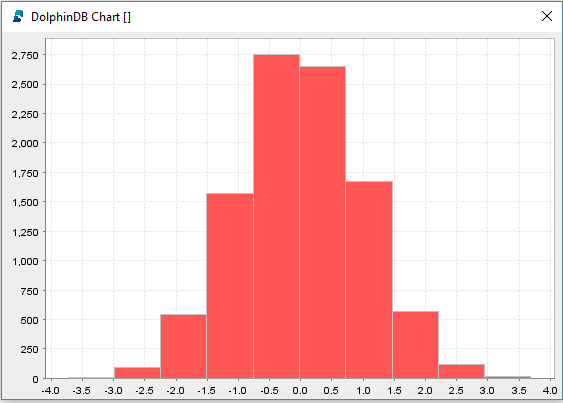
plotHist(x, 10, -2:2)