percentileRank
Syntax
percentileRank(X, score, [method='excel'])
Arguments
X is a numeric vector/matrix/table. If it is a matrix, calculate the percentile for each column and output a vector. If it is a table, calculate the percentile for each column and output a table.
score is a scalar. The function will calculate the rank of the score according to the X.
-
"excel" (default): The proportion of the number of elements smaller than score to the number of elements not equal to score. If score is not equal to any element in X, then percentile calculation formula will be as below:
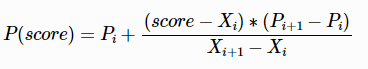
In the formula, Xi is the maximum less than score and Xi+1 is the minimum greater than score. Pi and Pi+1 is the percentile of Xi and Xi+1.
-
"rank": The percentage of the number of elements not greater than score to the number of elements in X. If there are multiple elements in X that is equal to score, take the average of their percentiles as the result.
-
"strict": The percentage of the number of elements smaller than score to the number of elements in X.
-
"weak": The percentage of the number of elements not greater than score to the number of elements in X.
-
"mean": The average value of "strict" and "weak".
Details
Calculate the percentile (0-100) of a score in a vector with NULL values ignored.
Examples
a = 2 3 4 4 5;
percentileRank(a, 4);
// output
66.666667
percentileRank(a, 3);
// output
25
percentileRank(a, 4, "rank");
// output
70
percentileRank(a,75,"weak");
// output
80
percentileRank(a,5,"strict");
// output
40
percentileRank(a,5,"mean");
// output
60

percentileRank(1 5 8, 6, "excel")
// output
66.666667