Cluster
The Cluster tab is displayed only for a DolphinDB cluster.
Agent
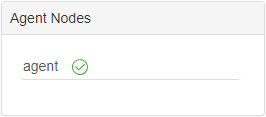
The agent nodes section displays the name and state of agent nodes.
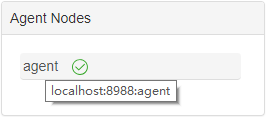
Hover over an agent node, and a small popup window displays the IP address, port number, and name of the agent node.
Toolbar

-
Click ← to hide the agent nodes.
-
Click ⏵ to start data nodes.
-
Click ⏹ to stop data nodes.
-
Click 🔄 to refresh the status of nodes.
To display only the nodes that share certain text in the node name as listed in the column "Node", we can enter the text in the box to the right of 🔄 and then click Enter.
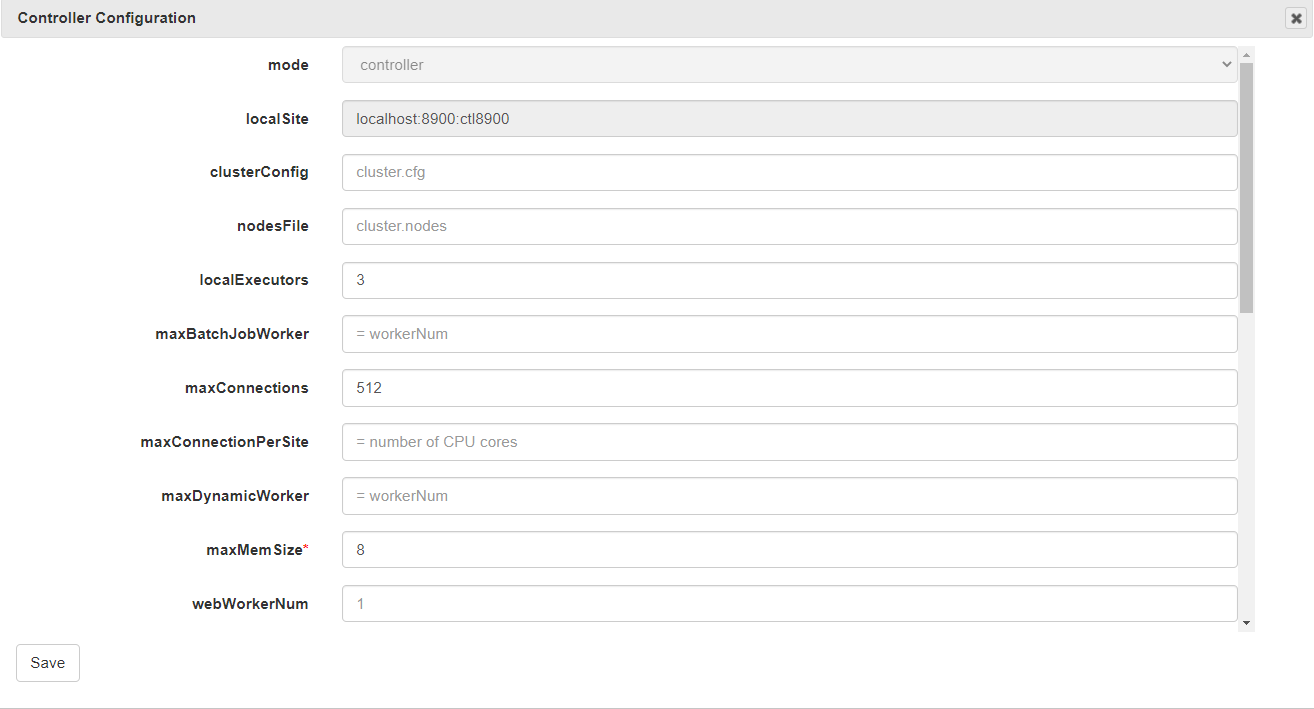
Click Controller Config to view and modify the configuration parameters for the controller, which is equivalent to modifying the controller.cfg file. Note the configuration takes effect only after the controller is rebooted.
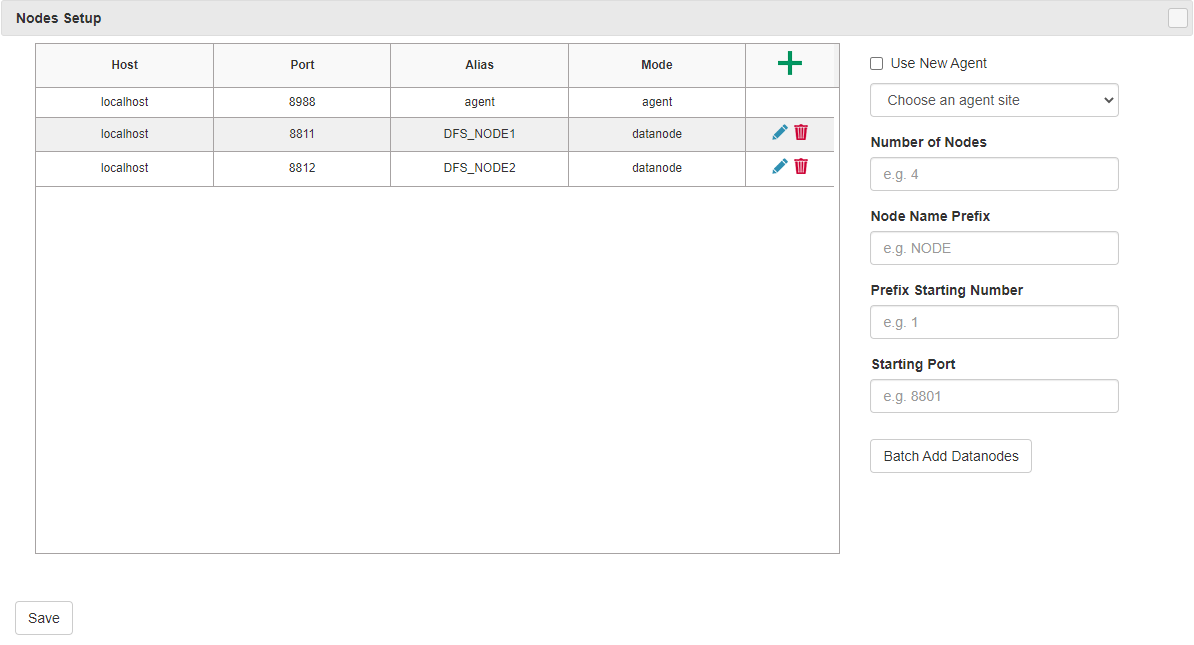
Click Nodes Setup to check the cluster environment. You can add, delete or edit data nodes, which is equivalent to modifying the cluster.nodes file.
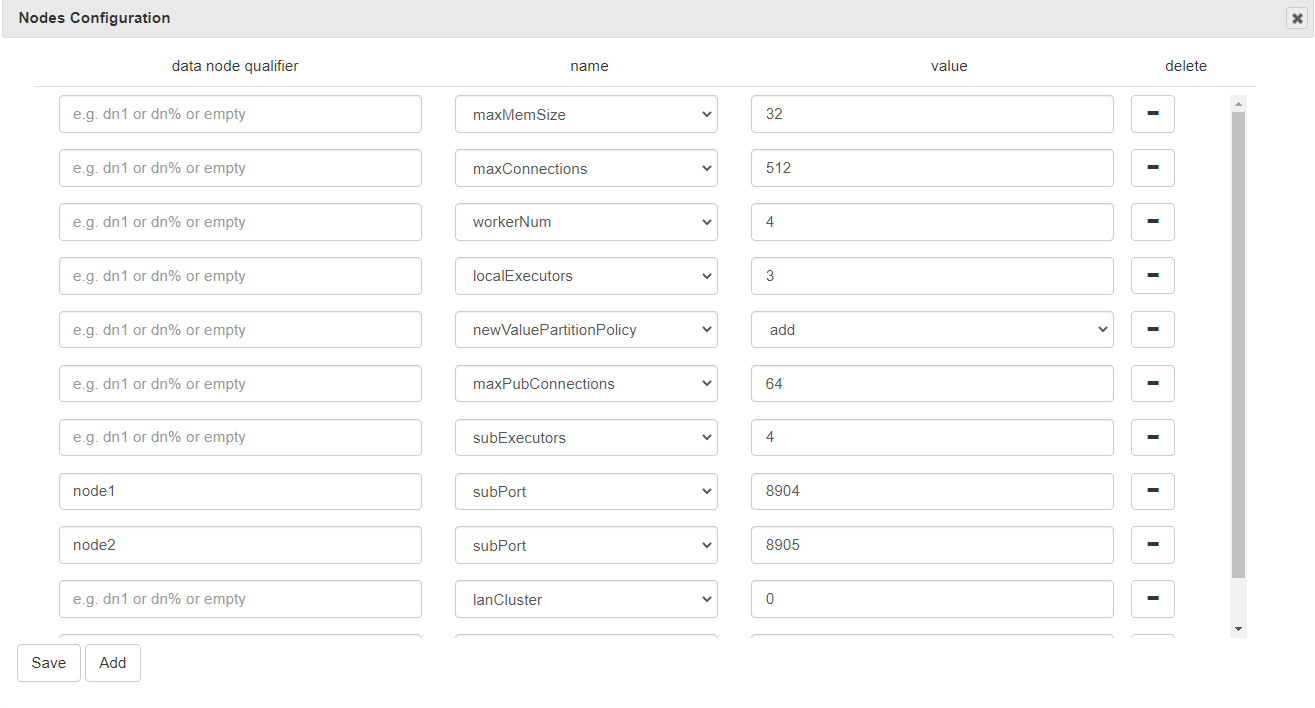
Click Nodes Config to view, add, modify or delete the configuration parameters, which is equivalent to modifying the cluster.cfg file.
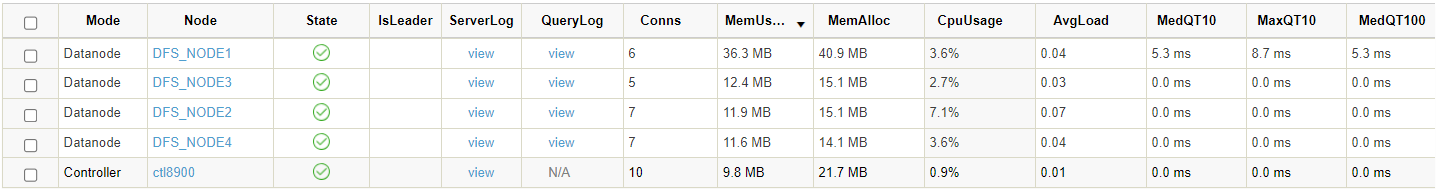
Performance Monitoring
The performance monitoring panel displays various performance monitoring measures for the controller and the data nodes.
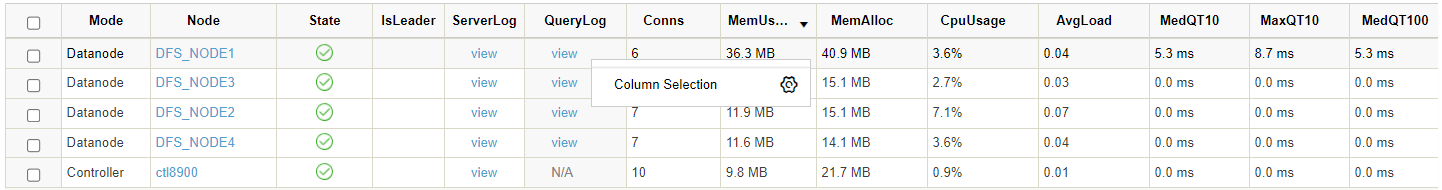
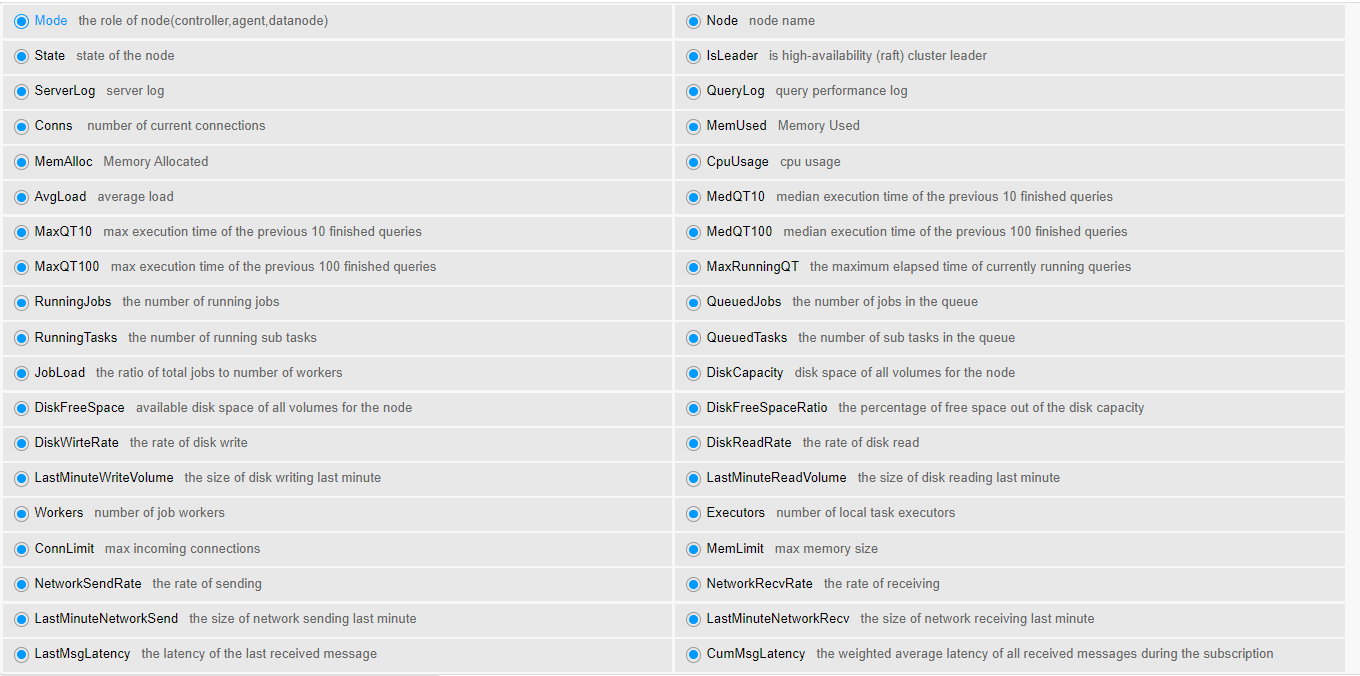
Users can select the performance monitoring measures to be displayed. To customize the display contents, move the cursor to the panel, right click and choose Column Selection.
To change the order of columns in the performance monitoring panel, you can directly drag a column.
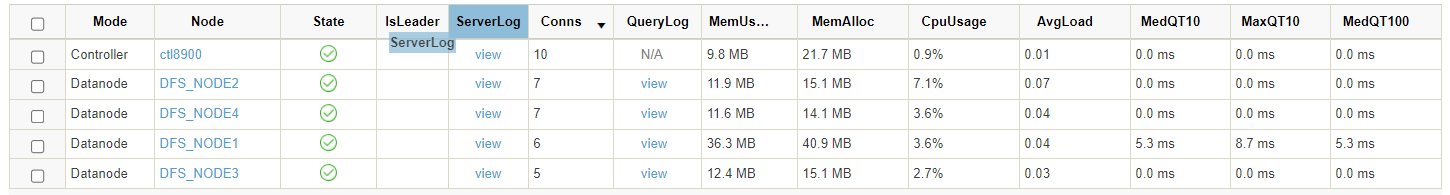
To check ServerLog or QueryLog of a particular node, click view in these 2 columns.