Debugging
This tutorial introduces how to debug DolphinDB scripts using the DolphinDB extension for Visual Studio Code (VS Code). The debug feature allows you to track script execution, inspect variables and call stack, and more.
Python Parser does not support debugging.
To use this feature, the version of your DolphinDB server must be 1.30.22.1/2.00.10.1 or higher.
| Component | Description |
|---|---|
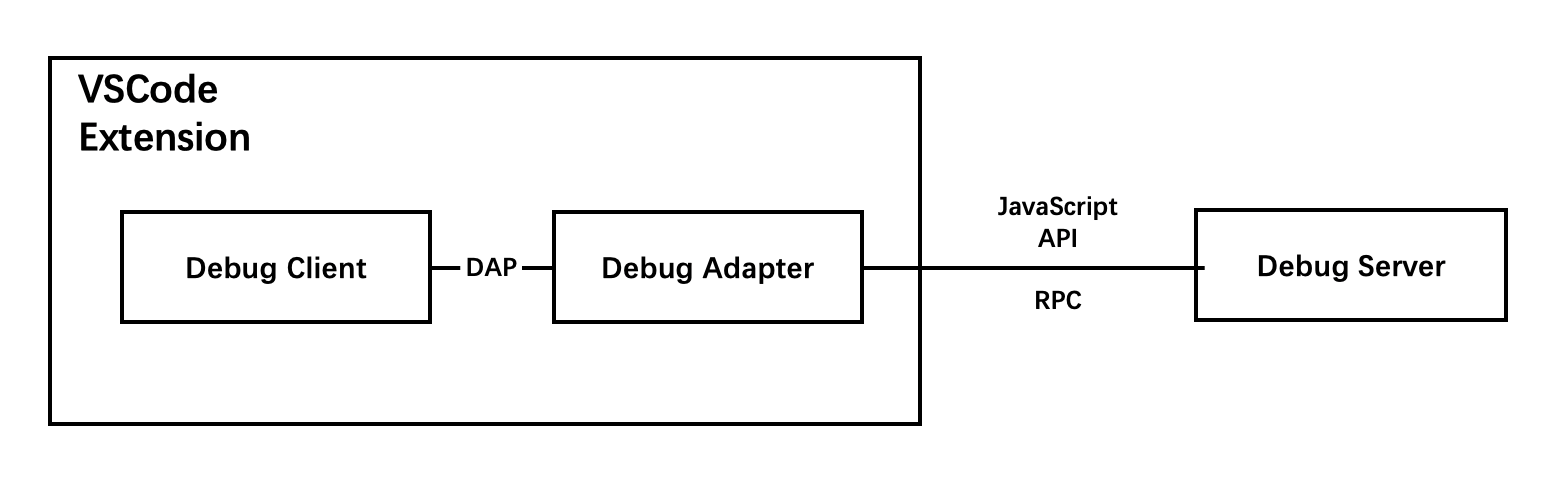
| Debug Server (DolphinDB Server) | The database process that handles interrupts, hangs, and queries. |
| Debug Adapter | An intermediary component which handles communication between VS Code extension and the DolphinDB server using DAP. |
| Debug Adapter Protocol (DAP) | An abstract communication protocol defined by Microsoft. |
| Debug Client | The user interface for debugging within VS Code. See screenshot below. |
Getting Started
Follow the steps below to start debugging with the DolphinDB extension.
Note: The version of your DolphinDB server must be 1.30.22.1/2.00.10.1 or higher.
Writing Script
For readability and convenience, it is a best practice to write only one statement per line in DolphinDB scripts. The following script will be used as an example in this tutorial:
use ta

close = 1..20
bret = bBands(close)
print(bret)

close = randNormal(50, 1, 20)
rret = rsi(close)
print(rret)
Setting Breakpoints
To set a break point, navigate to the desired line and left-click on the editor
margin. 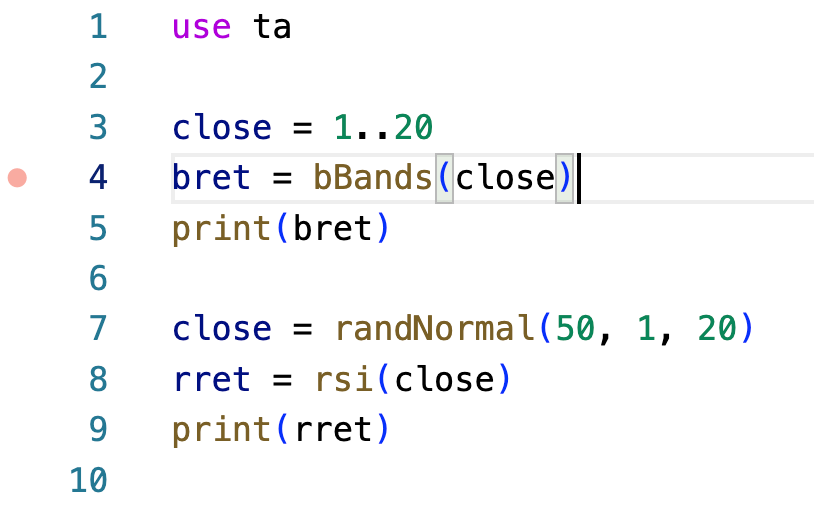
In this example, we set breakpoints on line 4 and line 8. This will insert red dots to mark those
lines as breakpoints. 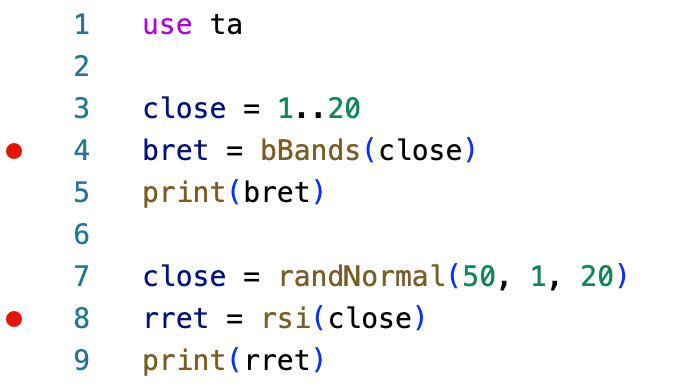
Starting Debugging
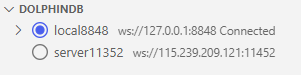
- Click the “EXPLORER” icon -> DOLPHINDB tab, select a DolphinDB server for debugging.
- In the Status Bar, make sure that “DolphinDB“ is selected as the scripting
language.

-
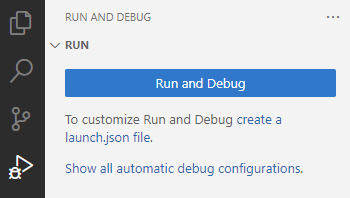
Launch the debug session by clicking the “Run and Debug” icon on the navigation sidebar and clicking Run and Debug. Alternatively, press the F5 key.
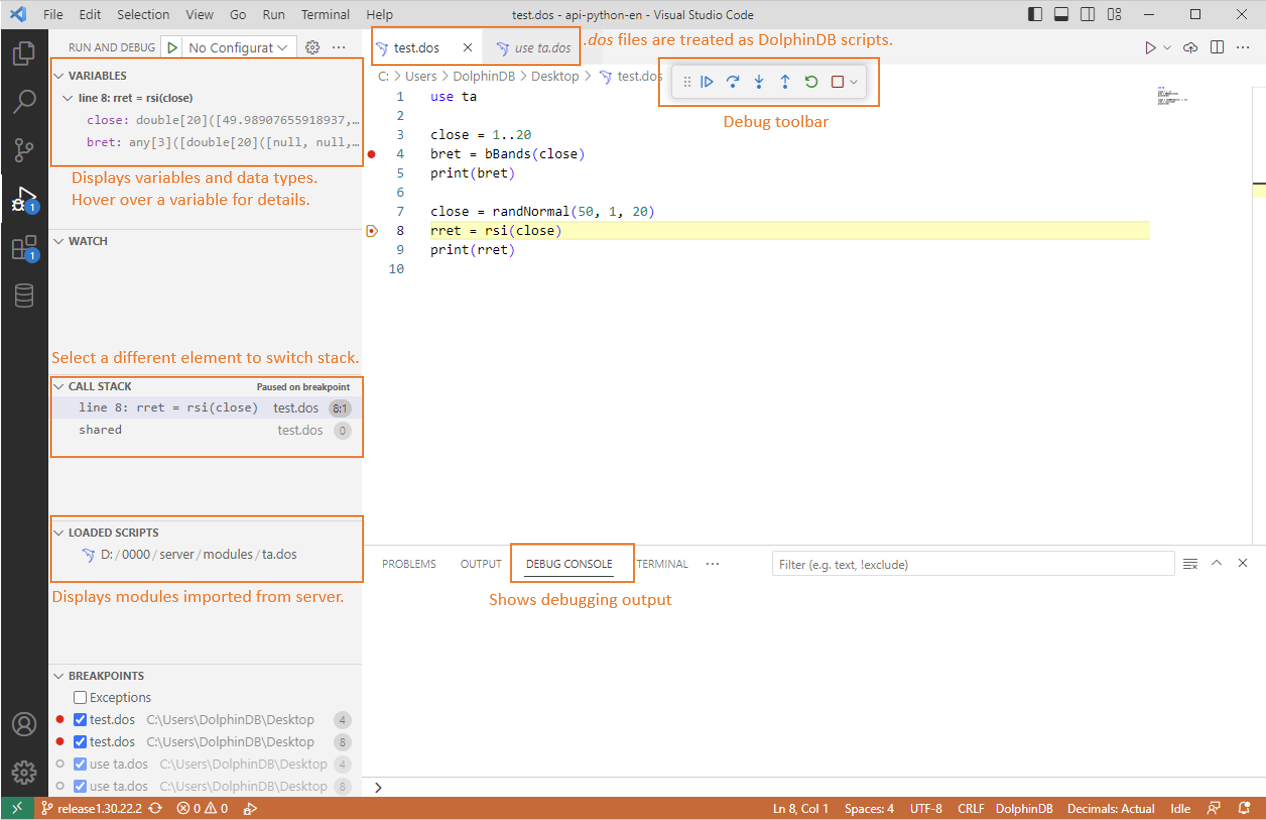
 The user interface is displayed as follows once the debug session starts:
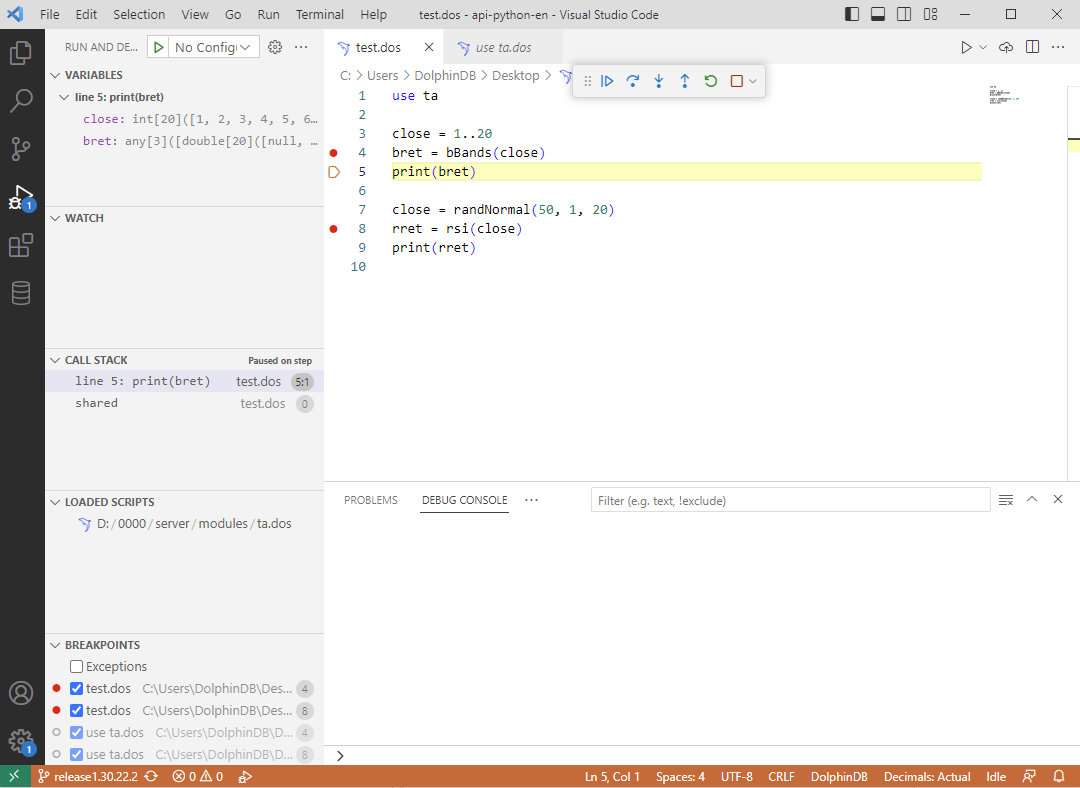
In the editor view, the line to be executed next is highlighted in yellow.
The DEBUG CONSOLE will display debugging output and exception information. If the debugging session fails to start, check the error message in the DEBUG CONSOLE.
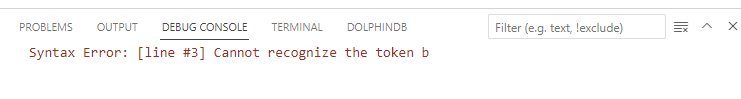
One possible reason is that the version of your DolphinDB server is outdated. In this case, the following error is reported:
socket
                                hang up Debug server connection failed, please make sure DolphinDB
                                Server version is not lower than 2.00.10.1 or 1.30.22.1
Debugging Actions
Once a debug session begins, a toolbar appears on the top of the editor. The following debugging actions are available: Continue, Step Over, Step Into, Step Out, Restart and Stop.
Step Over (F10)

Continue (F5)
Executing the script line-by-line can be time-consuming. Typically, we only want to inspect the execution at lines where breakpoints are set.
Variable Inspection
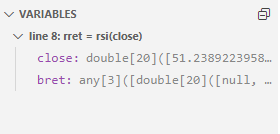
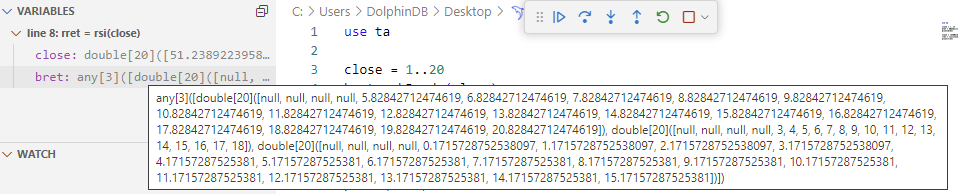
Right-click a variable and select View Variable to display it in the data view.
Step Into (F11)
This action allows the server to enter the next function and follow its execution line-by-line.
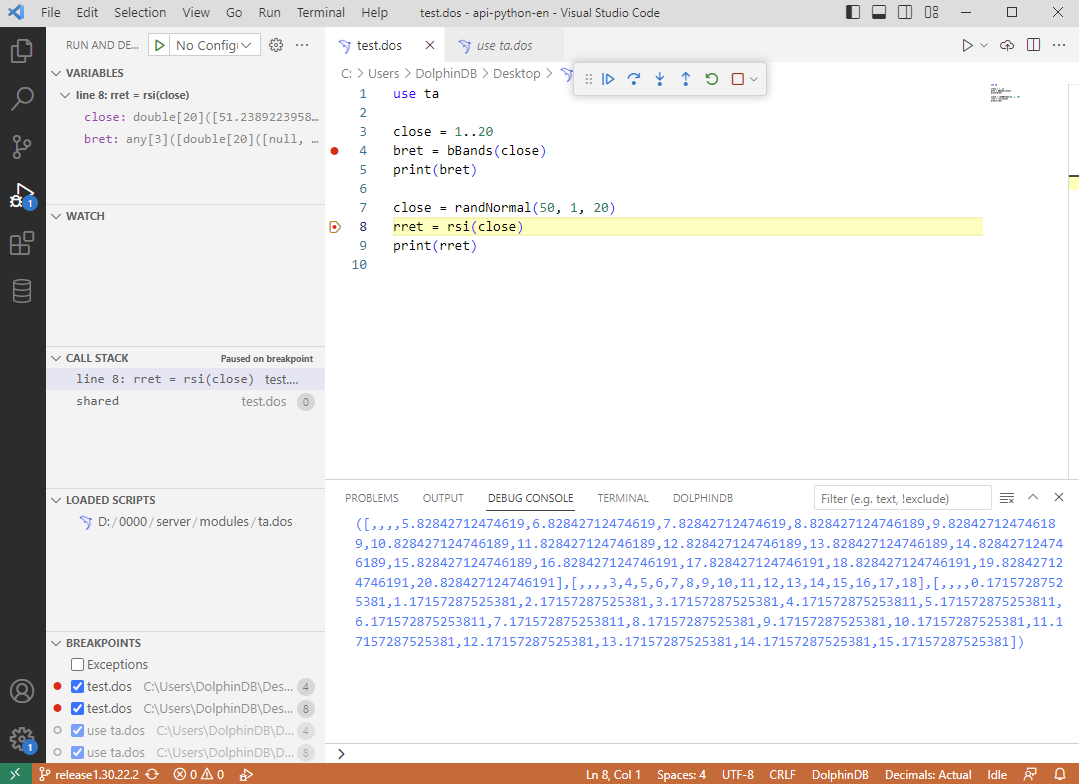
In this example, we have executed up to line 8 where the rsi
function is called.
rsi. The
highlight will move inside the function. As shown in the screenshot below,
the highlight indicates that the first line is to be executed next.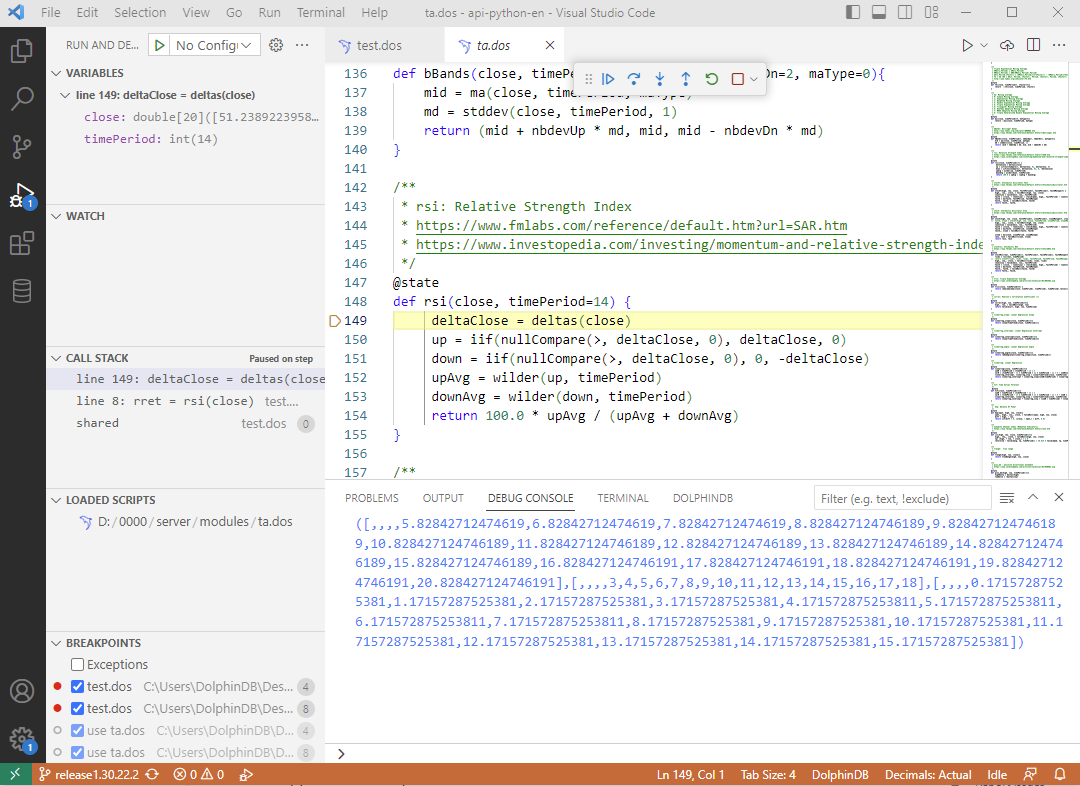
Call Stack Inspection
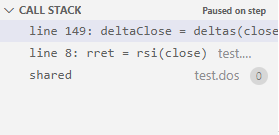
You can click on an entry to switch between functions. The VARIABLES view will display the variables for the currently selected function.
Dynamically Toggling Breakpoints
During script execution, we can dynamically update breakpoints. For example,
we can add two new breakpoints at lines 152 and 153, as shown in the
screenshot. Red dots will appear in the left margin of the editor,
indicating that the new breakpoints have been successfully added.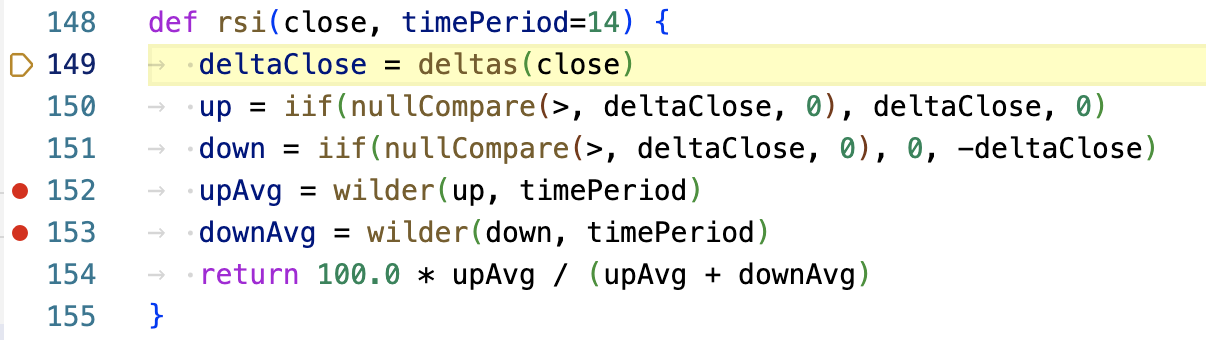
We can also remove breakpoints during execution. For example, clicking in the
left margin next to line 152 will delete the breakpoint on that line. As
shown in the screenshot, the red dot next to line 152 disappears, indicating
the breakpoint has been successfully removed.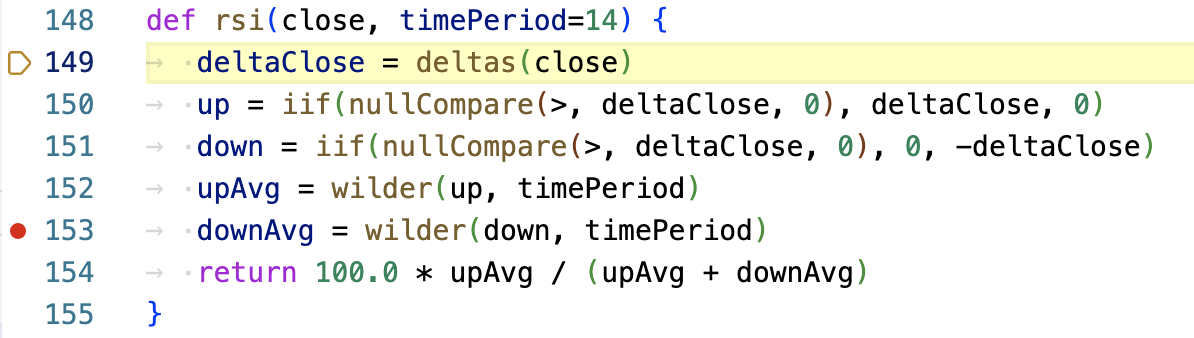
Step Out (Shift+F11)
When inside a function, click the “Step Out“ icon in the toolbar to complete remaining lines of the current function and return to the earlier execution context.
rsi function on line 8, we have stepped back out to
line 9 in the main script.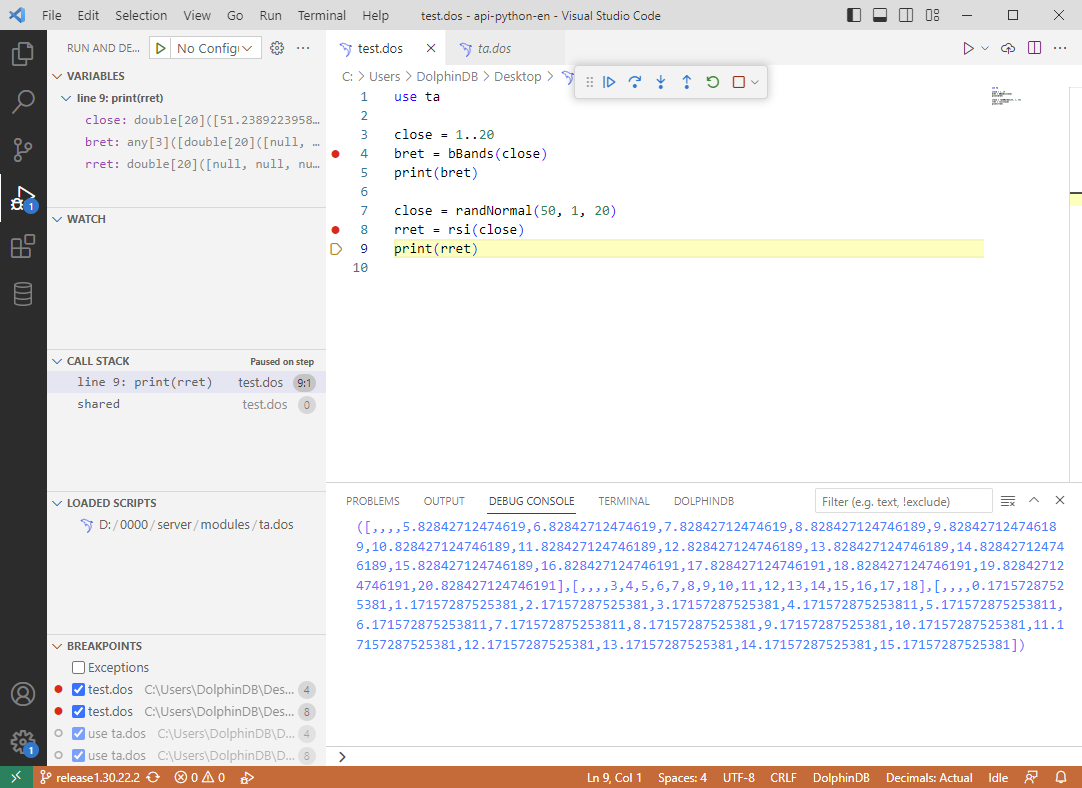
Restart and Stop (Shift+F5)
To stop the current script execution and start debugging again, click the “Restart“ icon in the toolbar.
To terminate the current execution, click the “Stop“ icon in the toolbar.
Advanced Features
Syntax Parsing
Breakpoint Management
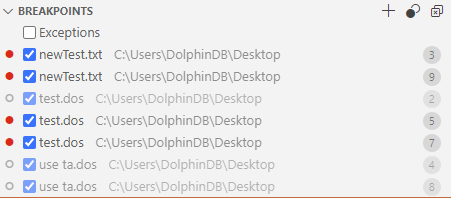
In the RUN and DEBUG view’s BREAKPOINTS section, you can view the details of each breakpoint, including its status, the script name, script directory, and line location.
To disable all breakpoints, click the “Toggle Activate Breakpoints“ icon in the upper-right corner. Click the icon again or add a new breakpoint to enable them.
Multi-Target Debugging
After you’ve started a debug session, just launch another session, and the VS Code will switch to multi-target mode. With the multi-target mode:
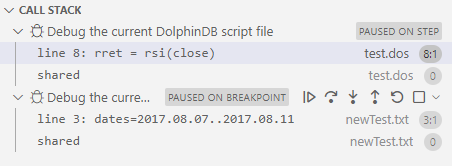
- Each session shows up as top-level element in the CALL STACK view.
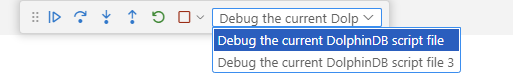
- The debug toolbar shows the currently active session. The other sessions are available in the dropdown menu.
- Debug actions are performed on the active session. To change the active session, using the dropdown menu in the debug toolbar, or switch to a different element in the CALL STACK view.
Currently Unsupported Features
Syntax
- Function views - While function views pass the initial syntax check, they will raise error once debugging begins;
includestatements - The error “Does not support Debug mode when using include“ will be raised. Please consider using theusestatement as an alternative.- Multithreading or remote procedure call functions like
submitJobandremoteRuncannot be tracked in the CALL STACK view. - Anonymous functions, lambda expressions and closure are not supported for debugging.
Debugging
- Inline breakpoints, conditional breakpoints, logpoints, watchpoints
- Viewing large variables
