DolphinDB Backend Datasource
DolphinDB offers a Go-based Grafana data source plugin ( dolphindb-datasource-go), which operates on the Grafana backend, enabling users to display DolphinDB time-series data in Grafana panels.
Note: To use this plugin, ensure that either:
- Grafana Server and the database are on the same network, or
- Grafana Server has network access to connect to the database.
Installation
Step 1: Install Grafana
Download and install the latest open-source version (OSS, Open-Source Software) in Grafana's official website.
Step 2: Install the dolphindb-datasource-go plugin
Download the latest plugin package in releases, such as dolphindb-datasource-go.v1.0.0.zip.
Extract the dolphindb-datasource-go folder from the zip package to the following path (if the plugins directory does not exist, you can create it manually):
- Windows: <grafana installation directory>\data\plugins\
- Linux: /var/lib/grafana/plugins/
The plugin directory should contain the following files:
plugins
├── dolphindb-datasource-go
│   ├── LICENSE
│   ├── README.md
│   ├── components
│   ├── go_plugin_build_manifest
│   ├── gpx_dolphindb_datasource_windows_amd64.exe
│   ├── img
│   ├── module.js
│   ├── static
│   └── plugin.json
├── other_plugin_1
├── other_plugin_2
└── ...
Step 3: Modify the Grafana configuration file
Read Configure Grafana.
Open and edit the configuration file under the [plugins] section. Uncomment allow_loading_unsigned_plugins and configure it to dolphindb-datasource-go, i.e., modify the following configuration:
# Enter a comma-separated list of plugin identifiers to identify plugins to load even if they are unsigned. Plugins with modified signatures are never loaded.
;allow_loading_unsigned_plugins =
to
# Enter a comma-separated list of plugin identifiers to identify plugins to load even if they are unsigned. Plugins with modified signatures are never loaded.
allow_loading_unsigned_plugins = dolphindb-datasource-goNote: Any configuration changes in Grafana require a restart to take effect.
Step 4: Start/Restart the Grafana process or service
Follow the instructions in Start the Grafana server to start the Grafana server.
Step 5: Verify that the plugin is loaded
You can see a log similar to the following in the grafana startup log.
WARN [05-19|12:05:48] Permitting unsigned plugin. This is not recommended logger=plugin.signature.validator pluginID=dolphindb-datasource-go pluginDir=<grafana 安装目录>/data/plugins/dolphindb-datasource-goLog file path:
- Windows: <grafana installation directory>\data\log\grafana.log
- Linux: /var/log/grafana/grafana.log
Or visit the following link to make sure that the DolphinDB plugin is in Installed status: http://localhost:3000/plugins.
Usage Instructions
This section provides a brief overview of visualizing DolphinDB data in Grafana. For more instructions, see Official Grafana Documentation.
Step 1: Open and log in to Grafana
Open http://localhost:3000. The initial username and password are both admin.
Step 2: Create a new DolphinDB data source
Open http://localhost:3000/datasources, or click Connections > Data sources on the left-side menu to add a data source. Enter "DolphinDB" in the tab and select the corresponding data source.
After filling in the ip:port details, as well as the username and password credentials required to access the database, click the Save & test button at the bottom.
Step 3: Visualize Data with Dashboard
In a new Panel, you can write query scripts or subscribe stream tables to visualize DolphinDB's time-series data.
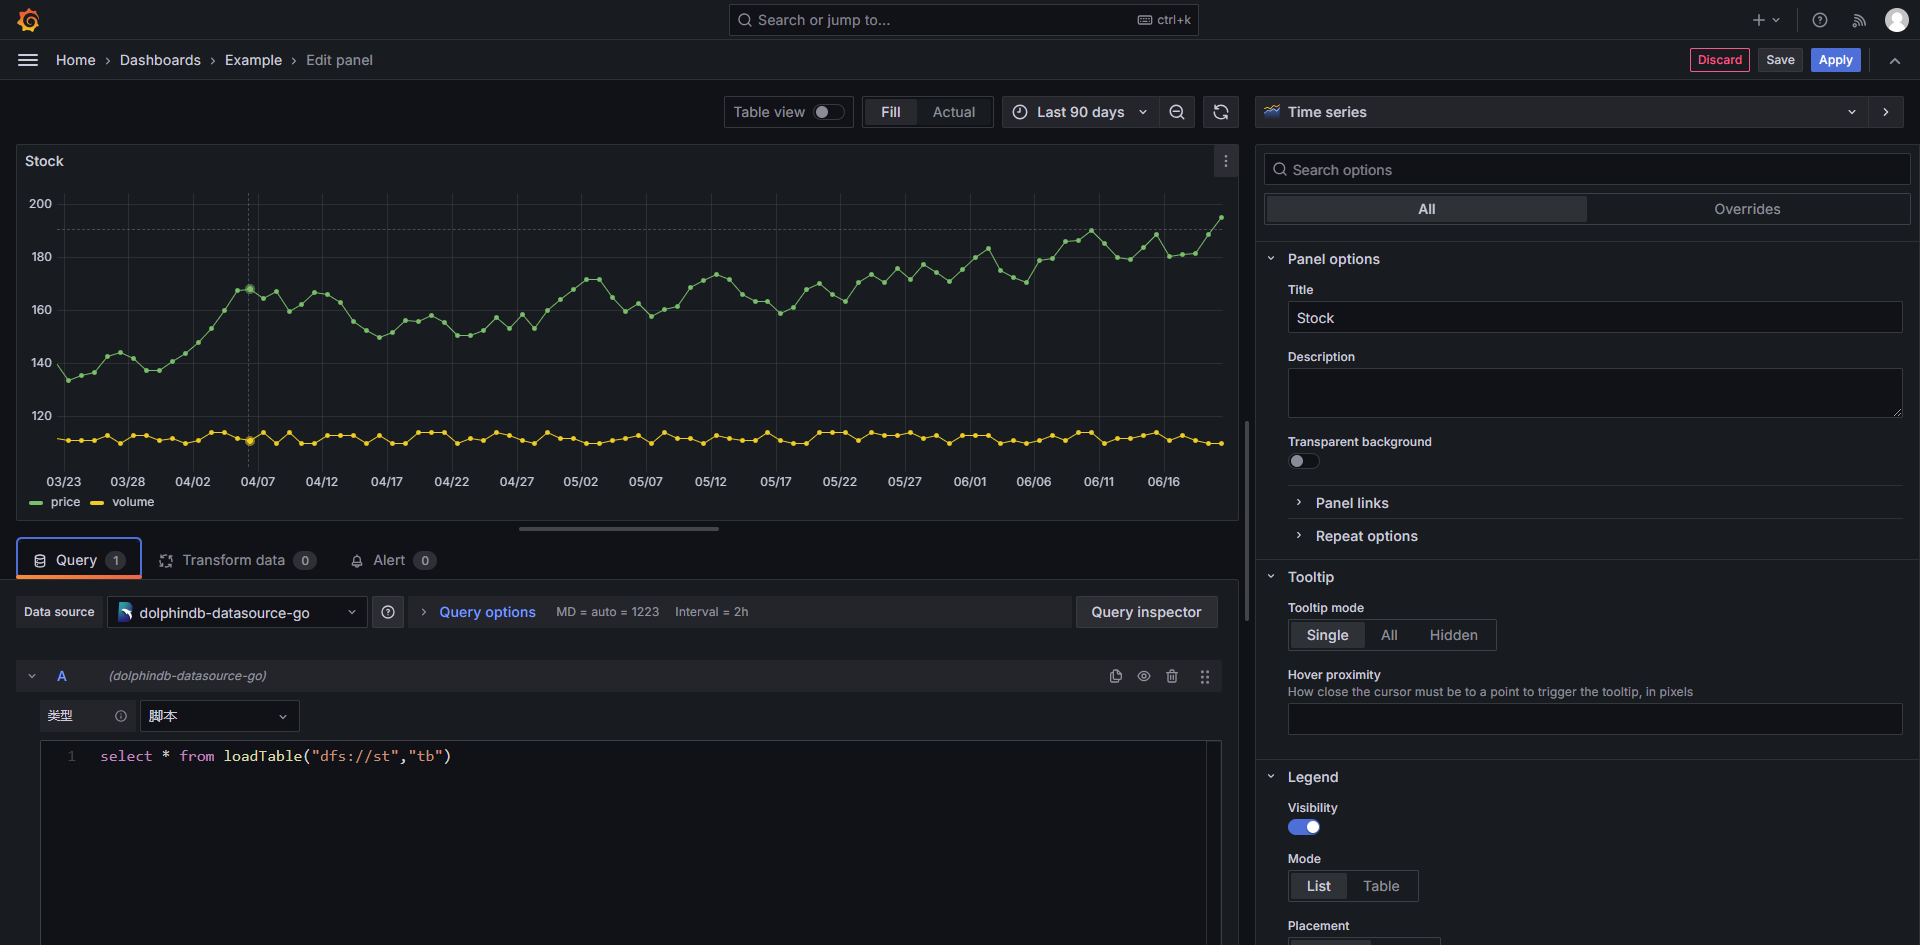
Open or create a Dashboard. In the dialog box that opens, select the data source you created. The Edit panel view will then open. You can now write DolphinDB query in the Query editor.
Write script to visualize returned table
- Set the Query type to script;
- Write a query script. The last statement of the code needs to return a table;
- After finishing writing, press "Ctrl + S" to save, or click the refresh icon (Refresh dashboard) to send the Query to the DolphinDB database for running and displaying the chart;
- The height of the code editing box can be adjusted by dragging the bottom border;
- Click the Save button in the upper right corner to save the Panel configuration.
dolphindb-datasource-go plugin supports the following built-in variables:
- $__timeFilter: The value is the time range of the time axis above
the panel. For example, if the current time range is 2022-02-15
00:00:00 - 2022.02.17 00:00:00, then
$__timeFilterin the code will be replaced withpair(2022.02.15 00:00:00.000, 2022.02.17 00:00:00.000). - $__interval and $__interval_ms: An interval used to group by time, which is automatically calculated by Grafana based on the time axis and the screen pixels. $__interval will be replaced with the corresponding DURATION type in DolphinDB; $__interval_ms will be replaced with the number of milliseconds (integer).
- query variable: Generate dynamic values or list of options via SQL queries.
For more variables, please refer to Grafana Variables.
Subscribe to and visualize stream tables
Requirement: DolphinDB server version >= 2.00.9/1.30.21
- Set Query type to Streaming;
- Fill in the name of the DolphinDB stream table you want to subscribe to;
- Click the Temporary Store button;
- Change the time range to Last 5 minutes (including the current time, such as Last x hour/minutes/seconds, instead of a historical time interval, otherwise you will not see the data)
-
Click the Save button in the upper right corner to save the Panel configuration.
Grafana Alerting
Grafana alerting allows you to create custom alert rules to track particular events or conditions. When these rules detect a specified situation, Grafana can automatically send notifications based on your predefined alert settings.
Let's explore how to use Grafana alerting with a simple example:
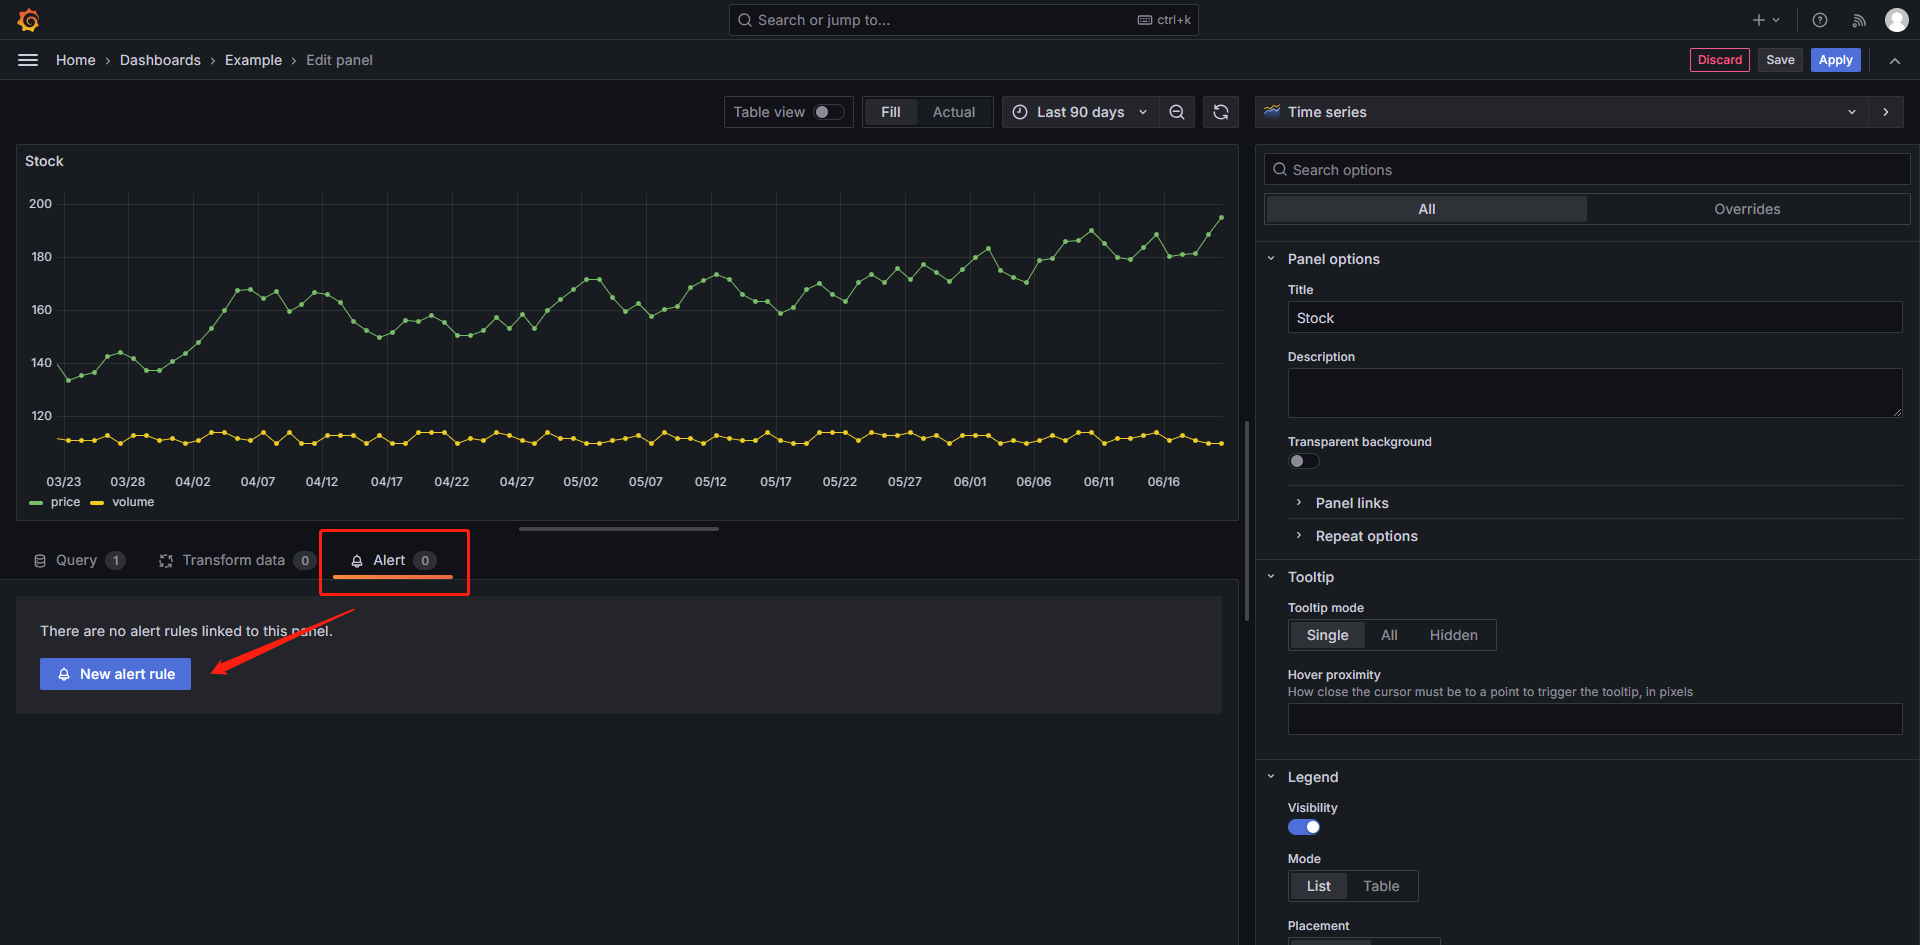
(1) Write a script in the Query editor, e.g., query the stock price of a company.
(2) Find the Alert tab in Data section, and choose New alert rule.
(3) Enter a name to identify your alert rule. Then, define a query to get the data you want to measure and a condition that needs to be met before an alert rule fires, e.g., time series data and stock prices.
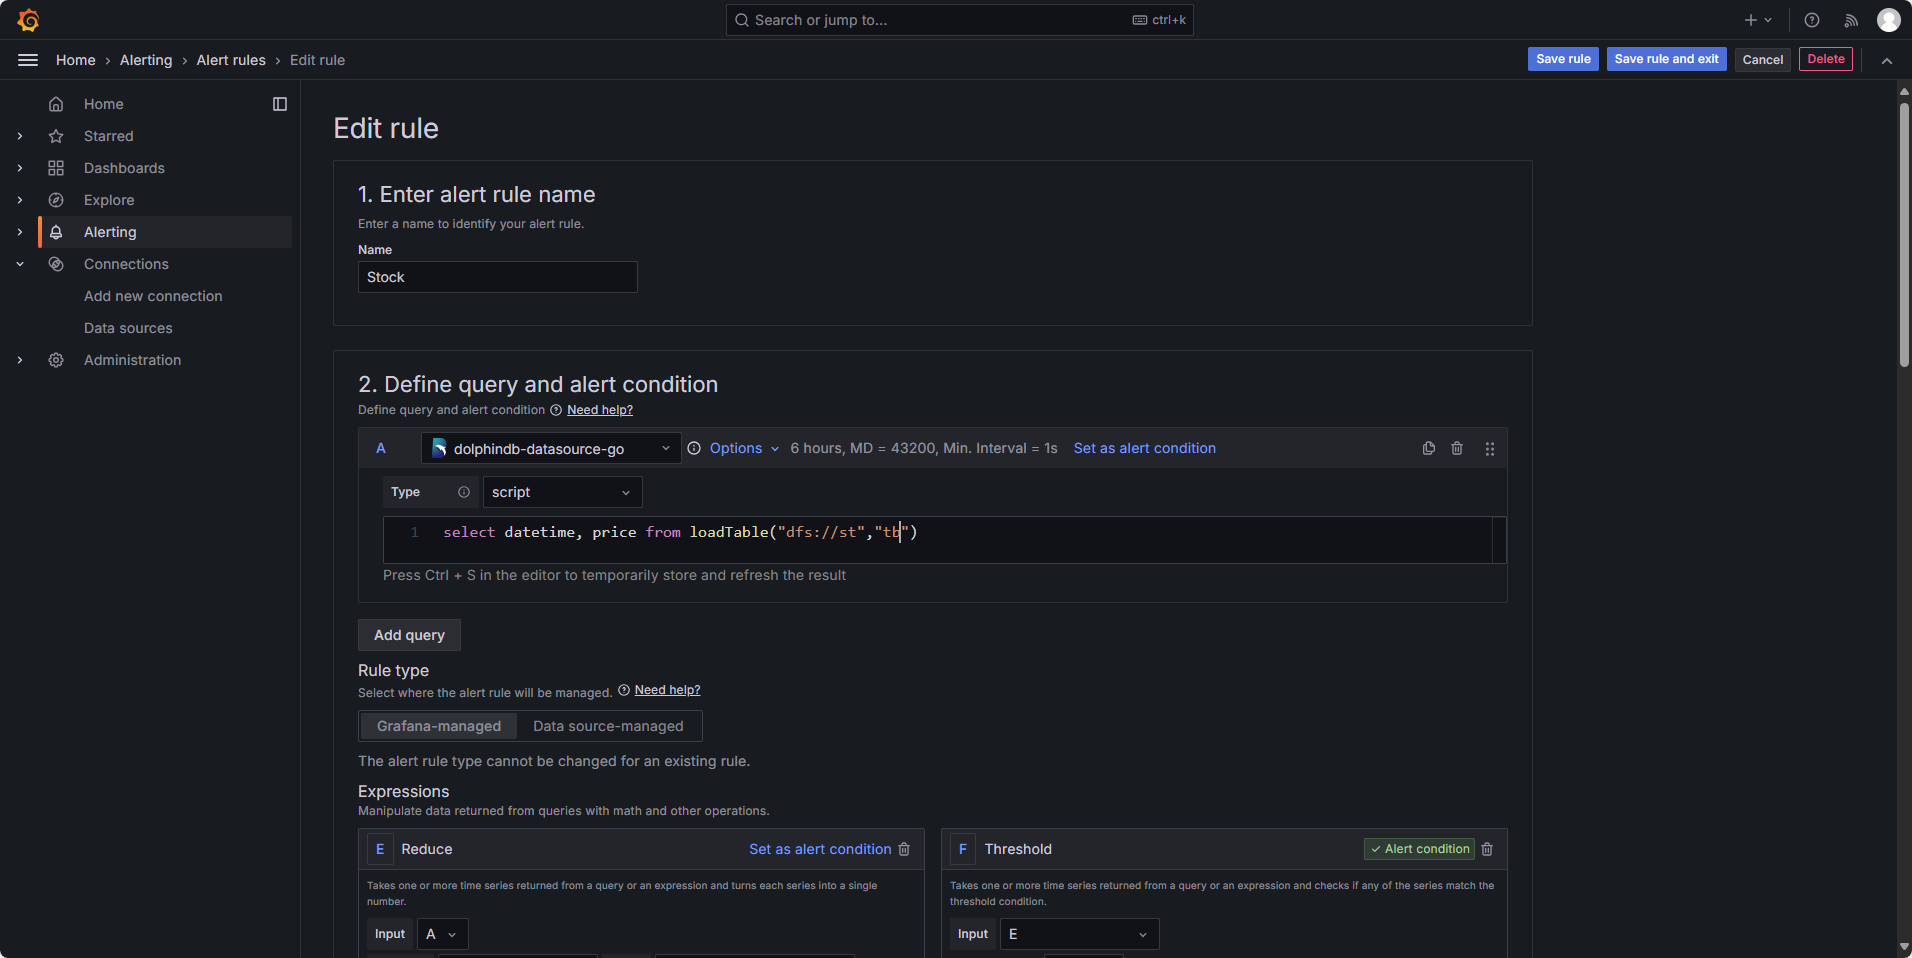
(4) Define a condition that needs to be met before an alert rule fires, e.g., alerting when the high price is greater than 180.
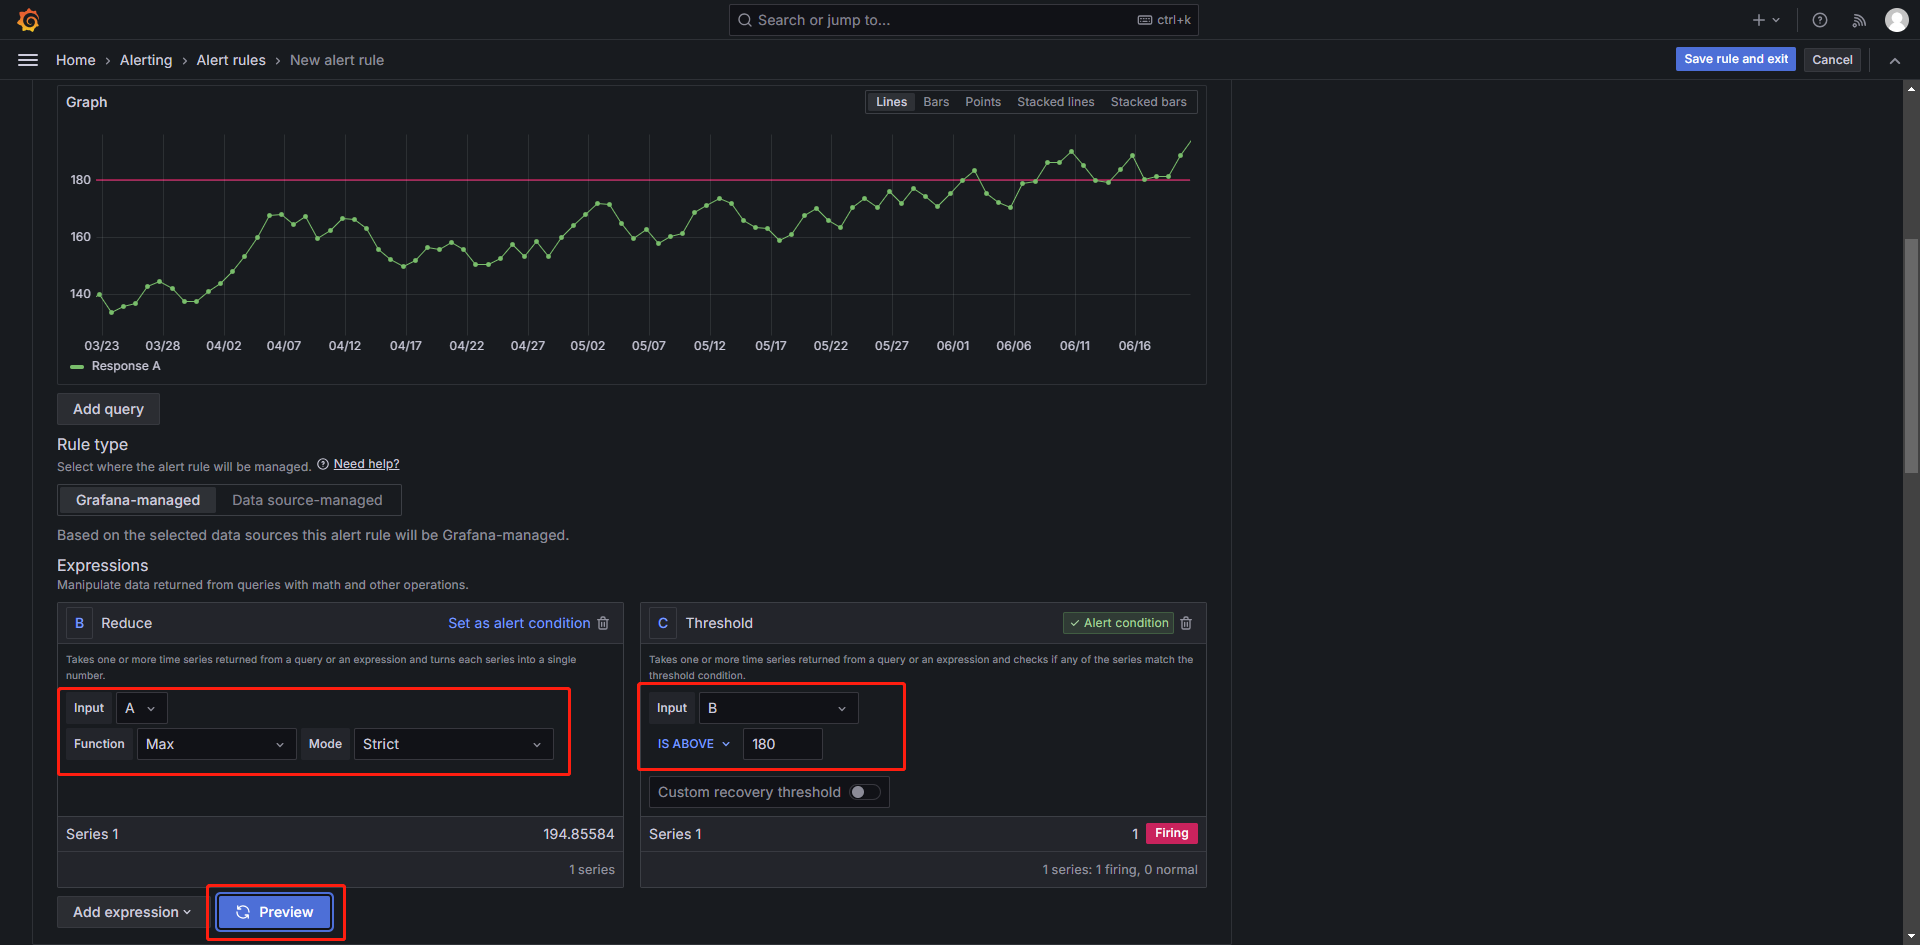
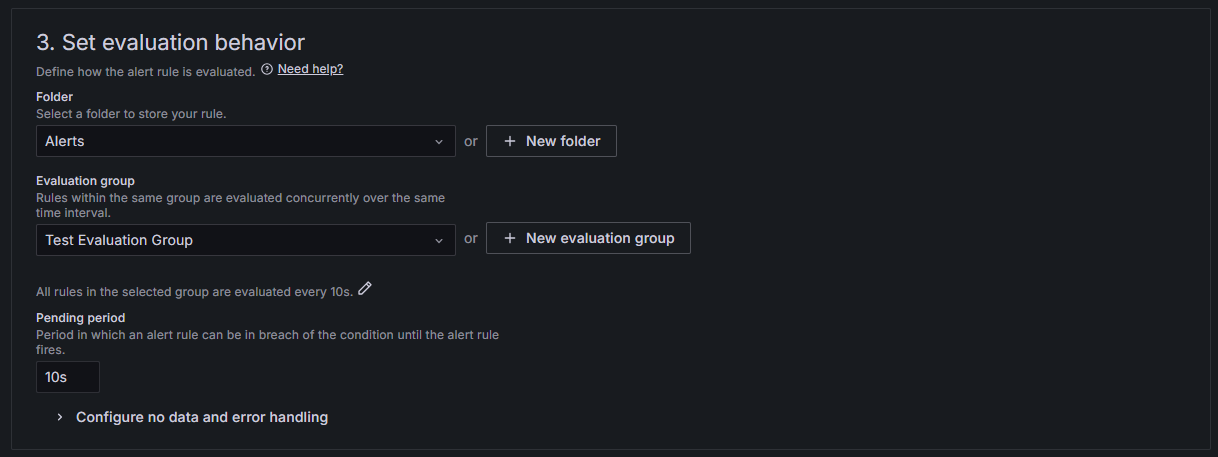
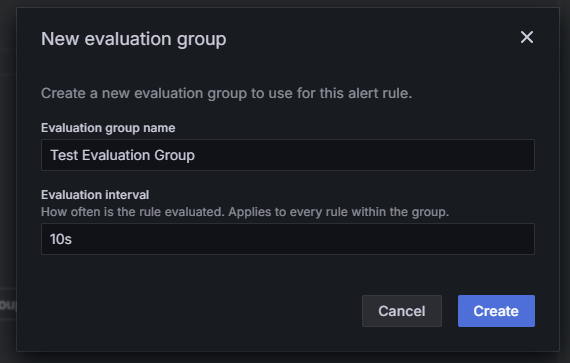
(5) Use alert rule evaluation to determine how frequently an alert rule should be evaluated and how quickly it should change its state. For example, the following configuration sets that all rules are evaluated every 10s and the alert rule fires if the condition remains active for 10s.
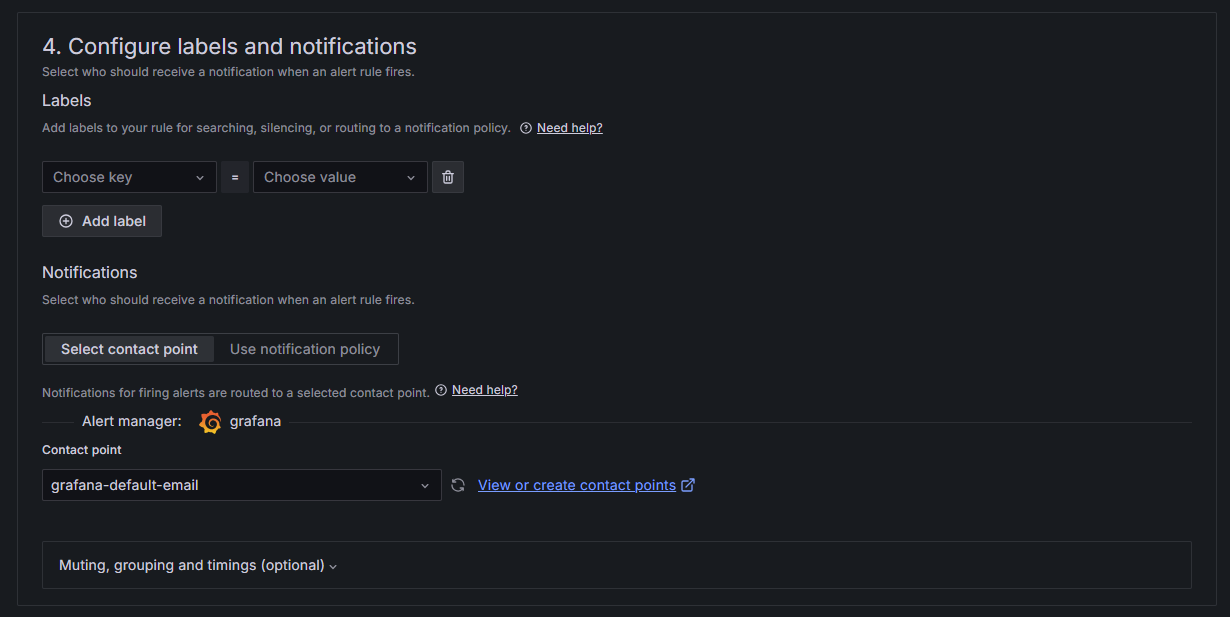
(6) (Optional) Configure notifications. Choose how, when, and where to send your alert notifications. Here, alerts are sent to a contact point, with the destination set as email. Alternatively, you can select other destinations supported by Grafana, such as Slack, Discord, Webhook, and more.
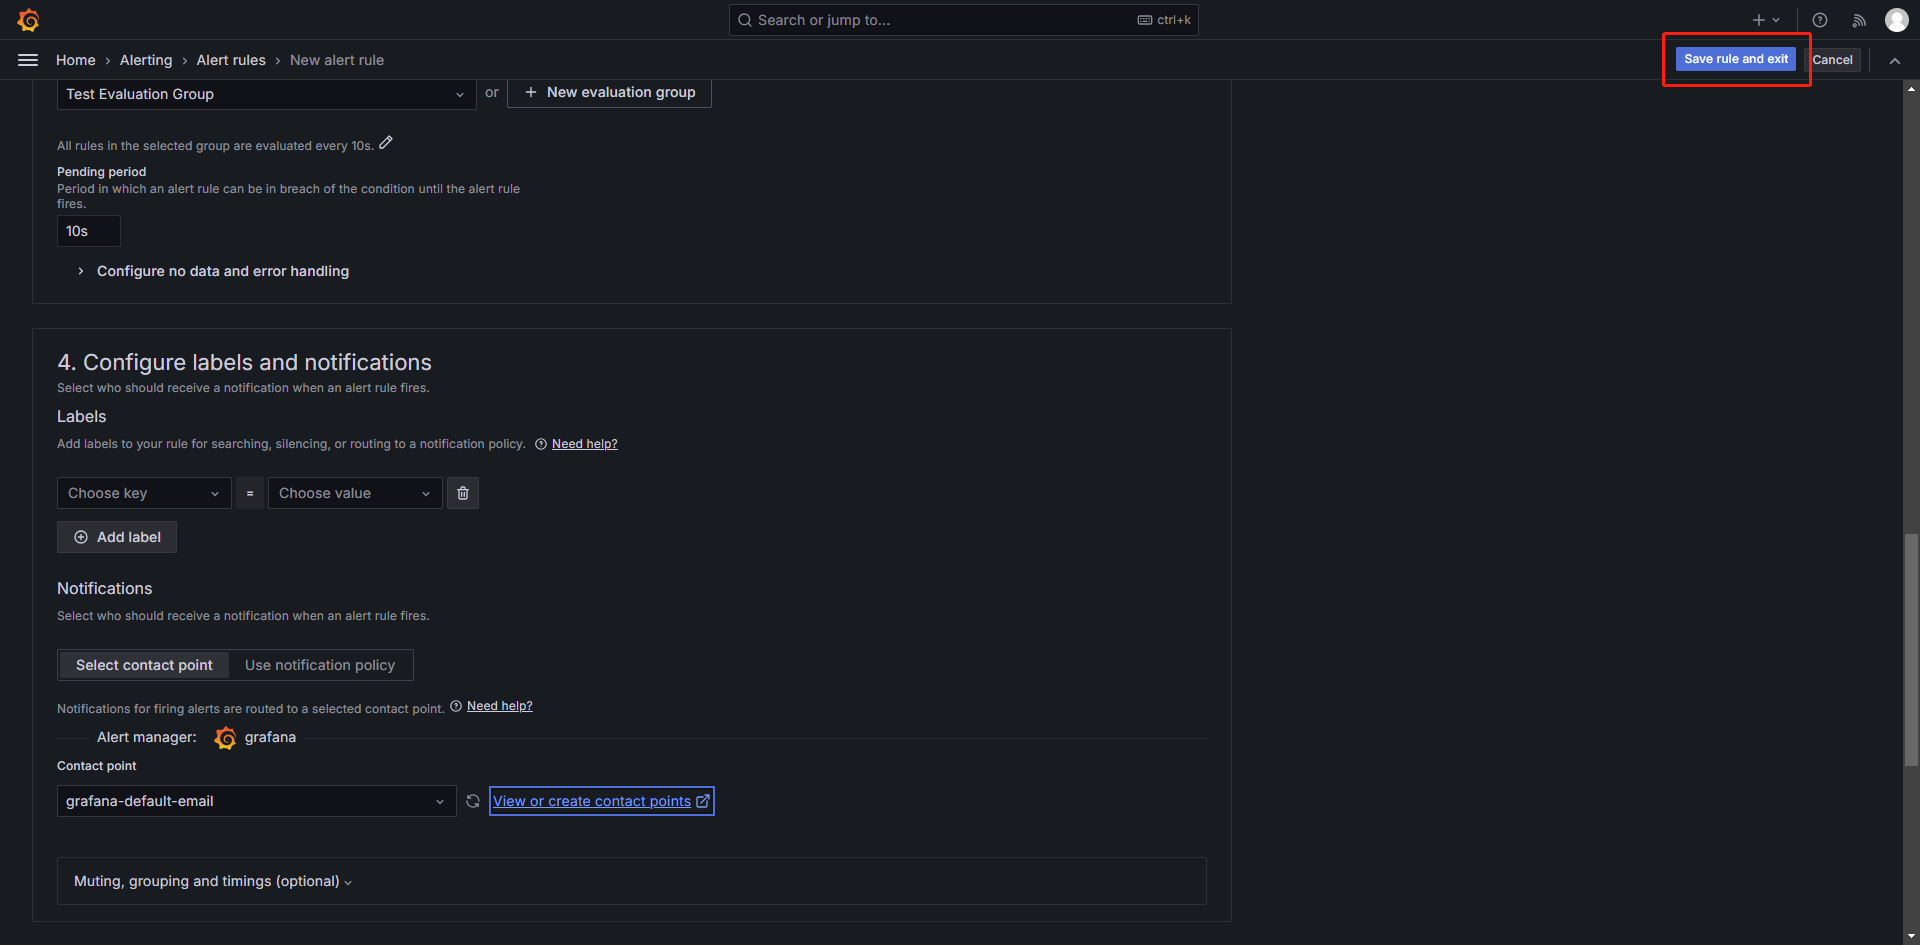
(7) Choose Save rule and exit.
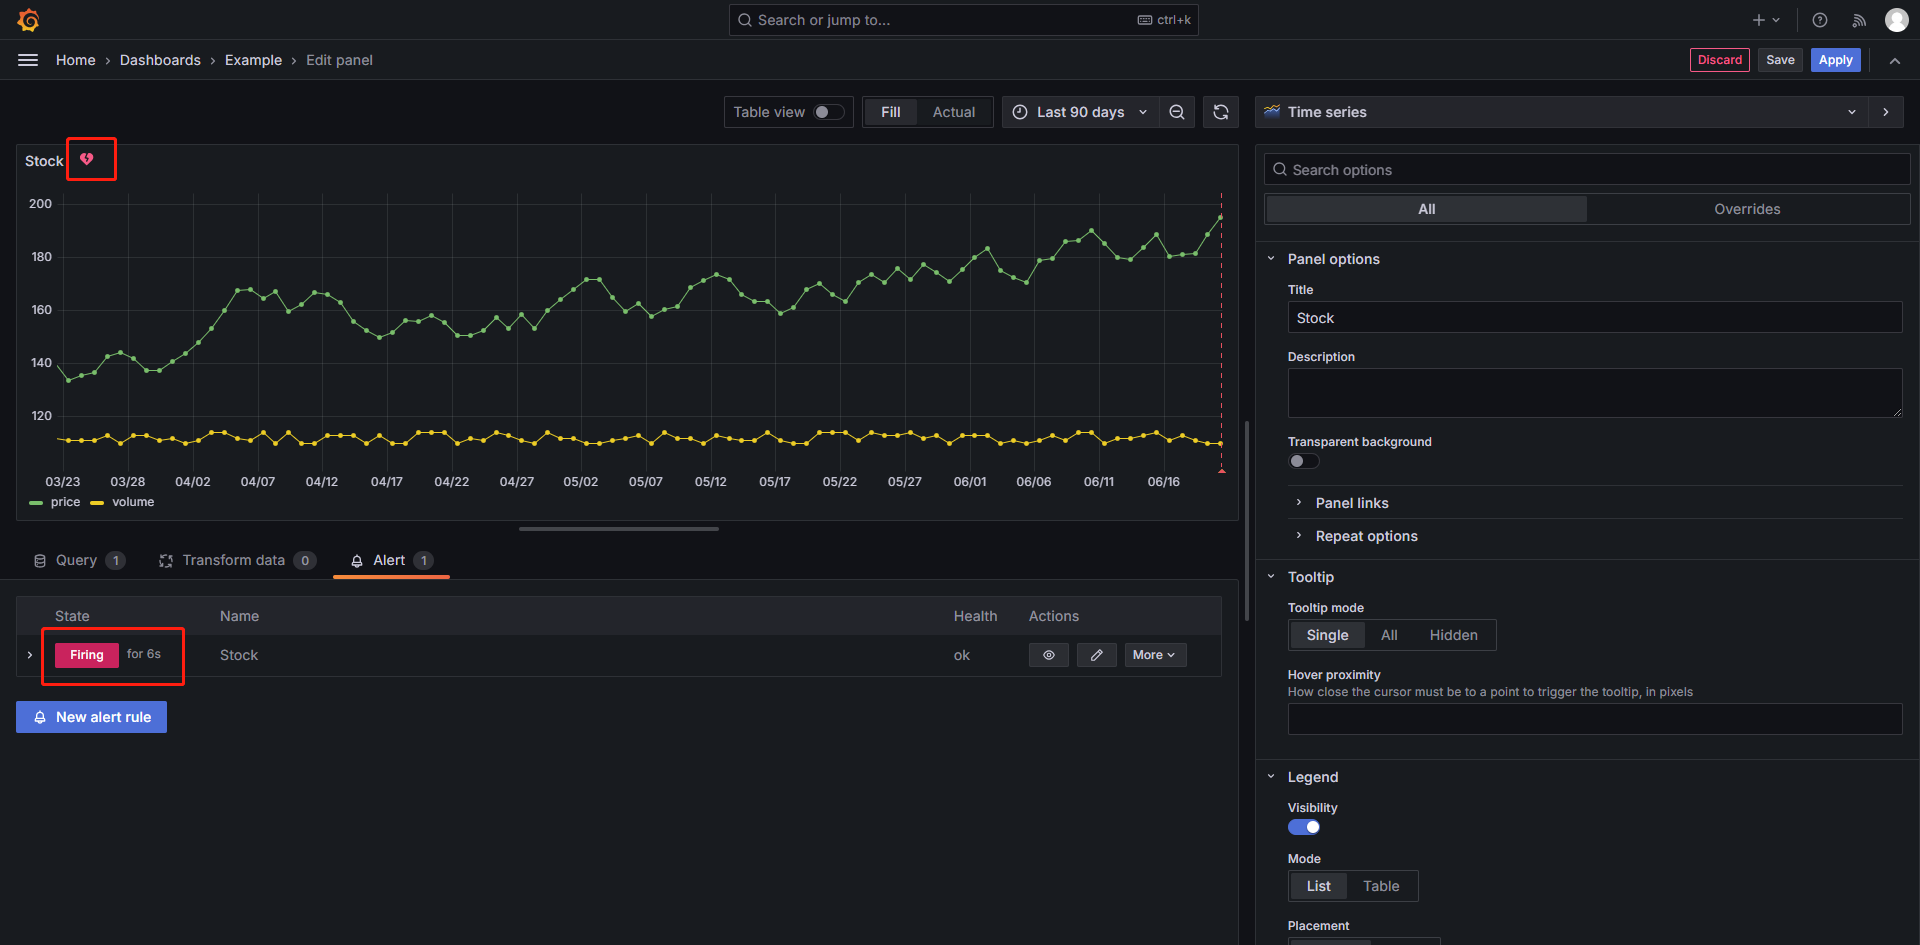
(8) Check whether the alerting works.
When the alert condition is met, it triggers an alert. The alert rule state transitions to Firing, and the alert instance state transitions to Alerting. Additionally, an alert icon will appear on the Panel.
FAQ
Q: How to set the auto-refresh interval of the Dashboard?
A:
- For "script" type: Click the dropdown menu to the right of the refresh icon in the upper right corner and choose Auto.
- For "streaming" type: Data arrives in real-time and no settings are required.
If you need to customize the refresh interval, navigate to Dashboard settings > Time options > Auto refresh, and enter a custom interval.
If you need to define a refresh interval smaller than 5s, such as 1s, you can modify the Grafana configuration file as follows and then restart.
[dashboards]
min_refresh_interval = 1s
For more instructions, see How to change refresh-rate from 5s to 1s.
Building and Development
# Install the latest version of nodejs
# https://nodejs.org/en/download/current/
git clone https://github.com/dolphindb/grafana-datasource-go.git
cd grafana-datasource-go
# Install project dependencies
npm i
# Development
npm run dev
# Build
npm run build
mage
# After completion, the product will be in the dist folder. Rename out to dolphindb-datasource-go